The Applicability of Big Data in Climate Change Research: The Importance of System of Systems Thinking
1. Introduction
Climate change is a pressing issue of today, for which data-based models and decision support techniques offer a more comprehensive understanding of its complexity. The aim of this paper is to reveal data-based techniques and their applicability in terms of climate researches. More precisely, how can Big Data, through data science answer sustainability climate issues and be applicable in scientific researches and decision sciences in an integrated manner.
The overview is guided through three closely related notions, namely, (1) data science as a novel interdisciplinary field connected to (2) machine learning that is a tool for improving automatic prediction or decision processes, and (3) Big Data which foster processing and connecting large amount of heterogeneous data. The focus point of this research is the interconnectedness of the complex climate-related systems, for which exploration Big Data provides an efficient toolbox.
Research questions formulated three aspects, which answering kept in focus through the whole paper:
• How and when Big Data appears in climate-related studies?
• What researches have been made in regard with Big Data applications in climate studies, and how they are structured?
• How to integrate the knowledge accumulated in diverse specific researches?
The year 2015 brought about further excitement in the field of research directions concerning climate change, as the United Nations declared 17 sustainable development goals, of which SDG13 is “Take urgent action to combat climate and its impacts” (UN, 2016) and the Paris Agreement has been signed, that concerning the mitigation of greenhouse gas emissions, adaptation and finance in 2015 with the specific aim of keeping global average temperature rises well below 2°C above pre-industrial levels and then continuing efforts to keep global temperature rises below 1.5°C above pre-industrial levels, recognizing that this will significantly reduce the risks and impacts of climate change (Rogelj et al., 2016). This kind of organizing principle supports the complex analysis of the classical disciplinary sciences with a holistic, interdisciplinary approach. New types of approaches require much more complex analyses and models and, therefore, several orders of magnitude more data, which brought Big Data to life as a stand-alone scientific discipline.
Big Data-based tools are already widespread in this new complex science, for example, to monitor seasonal changes in climate change (Manogaran et al., 2018), understand climate change as a theory-guided data science paradigm (Faghmous et al., 2014), learn how to manage the risks of climate change (Ford et al., 2016), explore soft data sources, e.g., Twitter (Jang et al., 2015), or demonstrate the potential of Systems of Systems (SoS), for instance, the exploration of the structure and relationships across institutions and disciplines of a global Big Earth Data cyber-infrastructure: the Global Earth Observation System of Systems (GEOSS) (Craglia et al., 2017).
Today, it is obvious that sustainability science is intertwined with data science, however, with the support of the business model of the circular economy (Jabbour et al., 2019), the complexity of the problem repository has further increased, so there is an urgent need to include data and analysis methods in the framework, whereas research results from different fields can be used in other fields. Furthermore, trends in climate and sustainability science are driving models toward higher resolution, greater complexity, and larger ensembles, which calls for multidisciplinary approaches in climate computational sciences (Balaji, 2015). This research provides a higher-level overview of the interconnectedness of disciplines, systems, data, and tools related to climate change, exploring further focal points concerning the need a deeper level of integration, because a disconnection between important industry initiatives and scientific research is still experienced (Nobre and Tavares, 2017). We propose to solve these integration tasks and disconnections by the System of Systems thinking.
This overview seeks to address these shortcomings. Information sources (data, news, scientific databases) can be linked, drawing attention to the future importance of open linked data. The present research draws attention to System of Systems (SoS) thinking, as the drivers and effects of climate change, as well as resilience and adaptation, can only be achieved through the timely recognition and exploitation of synergies and trade-offs between the new research directions.
The research methodology outlines firstly, the identification of sustainability science problems in section 2, which revealed the connected issues and tasks as well as the requirements needed to succeed. It ensured that sustainable operation of nature and society demands the approach of systems of system along with the integration of Big Data applications into climate-related scientific, societal, and political researches. This is in line with the growing risk of uncertainty zones highlighted in the planetary boundary framework (Steffen et al., 2015). Then, the existing applications of the related data analysis in the field was explored. For a deeper and narrowed insight, literature review was based on the PRISMA (Preferred Reporting Items for Systematic Reviews and Meta-Analyses) method, which contributes to the exploration and evaluation of related articles. The search has a clear and narrowed focus on the multidisciplinary nature of the issue, therefore the generic evaluation is not in purpose. Fifty-seven review articles were individually analyzed to identify focus areas and research gaps in the Big Data applications in climate change researches. Systematic meta-analysis was used to identify how data are clustering into diverse focus ares and to extract valuable structural information. The co-occurrences of keywords were examined with regard to 442 articles describing the relationship between climate change and Big Data.
In the following sections, the aforementioned research questions are being unfolded and answered through revealing the increasing importance of the System of Systems theorem. Synergies between new research directions and disciplines must be explored to determine the drivers and effects of climate issues as well as provide an efficient strategic adaptation and mitigation plan that also consider socio-environmental factors. Our proposed SoS framework is a response to this integrated knowledge management, as a first step toward climate computing.
In section 2, the sustainability science theorem questions are answered considering the essential need of data science applications. In section 3, heterogeneous data management as well as Big Data tools and techniques are emphasized.
The systematic review of climate change analyses can be found in section 4, which includes the connections between Big Data and climate in section 4.1 as well as a critical summary of different methods in section 4.2. The social aspects are highlighted in section 4.3. Based on the overview, from the new climate-related research findings, a specific SoS framework is presented in section 4.4 and the intertwining of the SoS and SDGs are discussed in section 5, where the suggestions for future research directions and applications are summarized.
2. Problems of Sustainability Science
The complexity of climate issues requires adaptive strategies for public policy (Di Gregorio et al., 2019), actions to incite social behavior (Xie B. et al., 2019), and the development of regulatory and market-simulating responses to economic life (Wright and Nyberg, 2017). To meet this complex societal need, research has focused on understanding the causes of climate change (Hegerl et al., 2019), the development of predictive models (Du et al., 2019), and mitigation solutions (Gomez-Zavaglia et al., 2020), as well as the exploration of opportunities to shape social attitudes (Iturriza et al., 2020).
An interdisciplinary approach is essential in terms of the identification of almost every climate-related problem and development of their solutions. This interdisciplinary perspective has formed sustainability science theorem to gain a comprehensive understanding of the interrelationship between environment and society (Kates et al., 2001). This theory focuses on transdisciplinary questions, which can only be answered by applying of data science tools.
• How can the dynamic relationship between nature and society be described and analyzed?
Systems Dynamics Modeling tends to be a commonly used tool when describing and analysing the dynamic interrelation of environment, economy, and society (Honti and Abonyi, 2019). This concept is clearly characterized by the World3 model, which describes the relationship between population, industrial growth, food production, and ecosystem constraints over time for the Club of Rome in the book entitled “The Limits to Growth” (Meadows et al., 1972). The exploration of the relationship between the state variables of the model requires targeted interdisciplinary research. The tools of data science can render this research more efficient with the automated generation and validation of relationship hypotheses (Sebestyén et al., 2019), as data-based models beyond the exploration of probabilistic correlations can provide information on causation (Dörgő et al., 2018). One of the most significant tasks for the more in depth analysis of climate effects is the integration and joint management of heterogeneous data and information. The proof of this potential approach is a case study that interlinks socio-economic variables to explore the effect of the climate on global food production systems (Fischer et al., 2005).
• How can delays, inertia, and uncertainty in models be handled?
To quantify the impact of uncertainties inherent in climate variables, the evaluation of Representative Concentration Pathways RCP 4.5 and RCP 8.5 CMIP models developed to forecast climate change (Taylor et al., 2012; Eyring et al., 2016), by using Monte Carlo simulations can be suitable (Mallick et al., 2018). The most important task ahead is the integrated development of targeted solutions for designing, evaluating and integrating simulation studies to quantify uncertainty and risk in the light of environmental and social data (Climate Change, 2014). For this reason DKRZ carried out extensive simulations with the Earth system model MPI-ESM with respect to the CMIP5 project and the IPCC AR5, presenting a selection of visualizations for different key climate variables and for the different scenarios (Klimarechenzentrum, 2021).
• How can the features concerning the vulnerability of socio-environmental systems be explored?
The conceptual framework of vulnerability is grounded by the Intergovernmental Panel on Climate Change (IPCC). The complex impact chains of vulnerability demand the identification and integration of non-climatic factors into climate models, in addition the development of models describing adaptability as well as the estimation of expected damage (Füssel and Klein, 2006). It is believed that the toolbox of network science will play an increasing role in evaluating vulnerability as the significance of state variables and their relationships can be directly qualified regarding their role in dynamic models (Leitold et al., 2020).
• How can the increasing risk be measured? What scientifically based “boundaries” and “limits” can be defined?
The purpose of the planetary boundaries concept is to define operating conditions and to account for adverse or catastrophic abrupt environmental changes in the crossing of one or more planetary boundaries (Rockström et al., 2009). Quantifying the risks of climate-induced changes using climate models shows that the risks will increase over the next 200 years, even if the composition of the atmosphere remains constant (Scholze et al., 2006). The socio-cultural domain plays a crucial role in terms of risk perception (Van der Linden, 2015), therefore, the integration of variables describing socio-cultural factors into the models can be particularly important. Analyses are essential to explore how human-induced perturbations affect the delicate balance of the ecosystem in addition to determining where the limits and boundaries are, the crossing of which would pose an unacceptable level of risk (Steffen et al., 2015). The integrated application of simulation tools and machine learning toolbox can efficiently explore these boundaries (Lenton, 2011).
• What support/motivation systems can be developed—rules, norms, scientific information—to increase the capacity and sustainability of society? What signs and guidelines are needed to put society on a sustainable path? How can today’s isolated research, analyses, and decision support systems be integrated more efficiently?
The integration and targeted systematization of scientific knowledge is needed to address the long-term causes of climate change and reduce its effects (Pauliuk, 2020). Research concerning sustainability and socio-ecological systems has been partly interlinked to foster sustainability transformation in a transdisciplinary manner. For bridging the gap between science and society, the involvement of citizens in framing research and processes may be a solution as “through their relationship to a place, bounded often as a social-ecological construct, stakeholders, and people at large play an essential role in sustainability transformation research.” Furthermore, the involvement of external parties can support research into socio-ecological systems and sustainability science (Horcea-Milcu et al., 2020). Methods of the co-production of knowledge, e.g., triangulation, the Multiple Evidence Based approach and scenario building, by learning about cross-border engagement, help to ensure that transdisciplinarity is not only a precursor of integration (Klenk and Meehan, 2015).
To follow the aforementioned path toward sustainable dynamics of nature and society, the data science toolbox and models must be integrated into climate change-related scientific and societal research as well as political agenda. In the following, the Big Data tools and management are interpreted with a specific focus on their role in climate change and we build a System of Systems (climate computing) framework from the various applications.
3. Data Analysis Tasks of Climate Change Researches
The term Big Data has spread due to new technologies and innovations that have emerged over the past decade (Chen and Chiang, 2012) given the demand for the analysis of large amounts of and rapidly generated diverse data, therefore, collection and processing takes place at a high speed, which is difficult to implement with calcareous analytical tools (Constantiou and Kallinikos, 2015). The explosive leap in the amount of data has also infiltrated health, finance, and education (Benjelloun et al., 2015). With regard to the global economy, Big Data is key to understanding and increasing performance (Maria et al., 2015). Big Data is also gaining ground in the field of sustainability, so it can be used to improve social and environmental sustainability in supply chains (Dubey et al., 2019), augment the informational landscape of smart sustainable cities (Bibri, 2018), and improve the allocation and utilization of natural resources (Song et al., 2017) as well as supply chain sustainability (Hazen et al., 2016).
Big and open data from “smart” government to transformational government can facilitate collaboration. It is possible to introduce real-time solutions into agriculture, health, transport, and other challenges (Bertot et al., 2014). The Big Data approach can be the most effective tool to improve mutual governmental and civic understanding, thus embodying the principles of digital governance as the most viable public management model (Clarke and Margetts, 2014). There is a need to collect large amounts of data that can be used to model and test different scenarios to sustainably transform energy production and consumption, improve food and water security, as well as eradicate poverty. Initiatives such as the Intergovernmental Panel on Climate Change and the Global Ocean Observing System can fill gaps in scientific, technical and socio-economic data (Gijzen, 2013). The analysis of sustainable business performance forecasts through the analysis of Big Data in the context of developing countries shows that “Management and leadership style” and “Government policy” are the most significant factors at present (Raut et al., 2019).
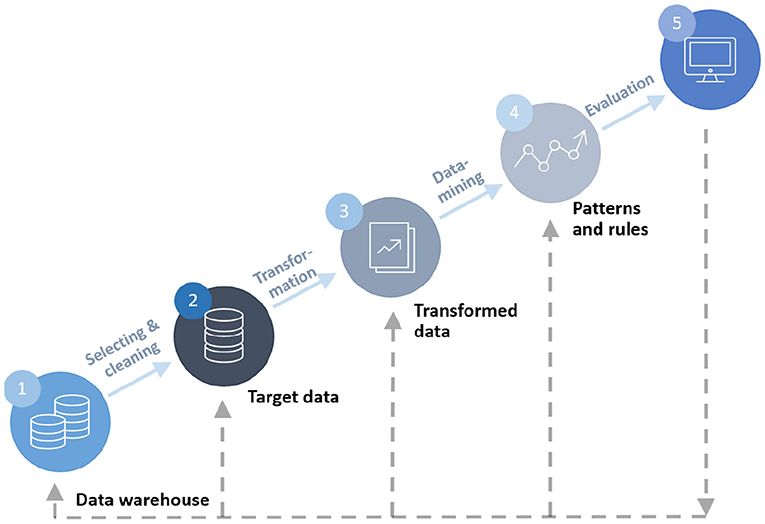
The process of data mining is shown in Figure 1.
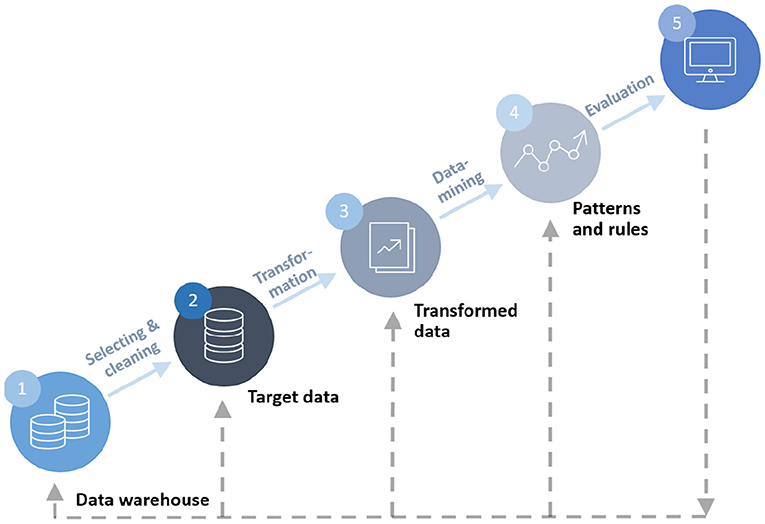
Figure 1. The process of data mining.
Big Data is a rapidly generated amount of information from a variety of sources and in a different format. Data analysis is the examination and transformation of raw data into interpretable information, while data science is a multidisciplinary field of various analyses, programming tools, and algorithms, forecasting analysis statistics as well as machine learning that aims to recognize and extract patterns in raw data. Thus, Big Data primarily looks at ways to analyse, systematically extract or otherwise handle data from datasets that are too large or complex to handle with traditional data processing application software that requires significant scaling (multiple nodes) to process efficiently. In other words, Big Data can be defined by the 5V key characteristics, i.e., volume, velocity, variety, veracity, and value (Laney, 2001).
The storage, sustainability, and analysis of massive content is a challenge that the current state of algorithms and systems cannot handle (Trifu and Ivan, 2014) in an integrated manner, therefore the synergies of the different sources are not sufficiently exploited. The purpose of using Big Data is to provide data management and analysis tools for the ever-increasing amount of data (Anuradha et al., 2015). As is shown in Figure 2, data analysis can be divided into four general categories (Erl et al., 2016). In the environments of Big Data analytics, data analytics involves the use of highly scalable distributed frameworks and technologies to extract meaningful information from large amounts of raw data that requires the use of different data analysis methods (Rajaraman, 2016).
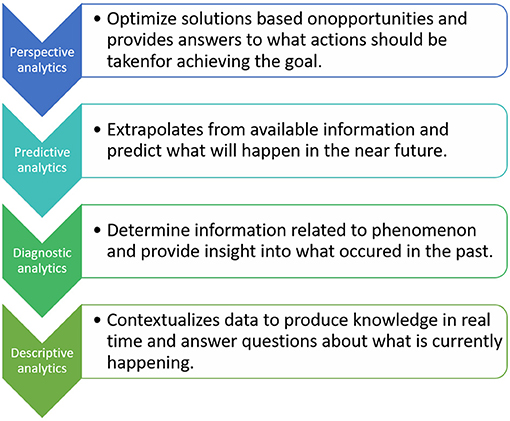
Figure 2. The types of data analytics.
Big Data is usually associated with two technologies, cloud computing and the Internet of Things (IoT) (Honti and Abonyi, 2019). Cloud computing accelerates unlimited data storage, parallel data processing, and analysis (Inukollu et al., 2014). The key benefits of cloud computing are improved analysis, simplified infrastructure, and cost reduction. IoT offers the ability to connect computing devices, mechanical and digital machines as well as objects and people (Lavin et al., 2015). With the advent of the IoT, huge amounts of data can be collected using smart devices connected via the Internet (Suchetha et al., 2015).
The applicability of Big Data techniques is also significantly enhanced by the novel tools that support data collection and integration. The interoperability of the systems can be improved by data warehouses and the related ETL (extract, transform, load) functionalities that can also be used to gather information from multiple models and data sources. The benefit of these structure are demonstrated in the EC4MACS (European Consortium for Modeling of Air Pollution and Climate Strategies) data warehouse that establishes a suite of modeling tools for a comprehensive integrated assessment of the effectiveness of emission control strategies for air pollutants and greenhouse gases. In this system the integrated data are loaded into the GAINS (Greenhouse gas-Air pollution Interactions and Synergies) Data Warehouse. This assessment brought together expert knowledge in the fields of energy, transport, agriculture, forestry, land use, atmospheric dispersion, health and vegetation impacts, and it developed a coherent outlook into the future options to reduce atmospheric pollution in Europe (Nguyen et al., 2012).
The integration of different information can also be supported by ontology-based linked data. Ontology Web Language (OWL) models enables the semantic characterization of the different events that can describe the climate change story from multiple perspectives, including scientific, social, political, and technological ones (Pileggi et al., 2020).
Artificial intelligence (AI) and machine learning (ML) are also the key enabler technologies of big data analysis. This paper focuses on the applicability of ML-based models. AI is mainly used to support decision-making, but it also can skilfully fill observational gaps when combined with numerical climate model data. An example of this application can be found in the extension of historical temperature measurements used in global climate datasets like HadCRUT4 (Kadow et al., 2020).
Analysis of Big Data combines traditional methods of statistical analysis with computational approaches. Based on the complexity between the variables and the type of results required, data analysis can be a simple data set query or a combination of sophisticated analysis techniques (Al-Shiakhli, 2019). The analysis of Big Data is a synthesis of quantitative and qualitative analyses. Climate computing combines multidisciplinary researches in regard to climatic, data and system sciences to efficiently capture and analyse climate-related Big Data as well as to support socio-environmental efforts. Underlying this aspect, a complex model of the earth system is continuously developed by DKRZ using supercomputers relying on Big Data, numerical computations, and simulation models to enable scientists to integrate chemical and biological processes, as well as investigate the interaction of the climate and the socio-economic system (Klimarechenzentrum, 2021).
Exploratory Data Analysis (EDA) techniques are approaches for analysing large data sets. These techniques make the main features clearer by hiding other aspects. Most EDA techniques are graphical in nature, with some non-graphical additions. Some basic EDA tools are histograms, quantile quantile plots (Q-Q-plots), scatter plots, box plots, stratification, log transformation, and other summary statistics (Komorowski et al., 2016). Qualitative models can be classified into qualitative causal models and abstraction hierarchies. The causal models can be classified into Digraphs, Fault Trees, and Qualitative Physics. Abstraction hierarchies consist of two important components: structural and functional (Venkatasubramanian et al., 2003).
Data mining is a set of methods that extracts certain information from large and complex databases. Data discovery uses automated, software-based techniques to eliminate randomness and uncover hidden patterns and trends (Fayyad and Simoudis, 1997). The classification of data mining techniques is summarized in Table 1 (Zaki and Ho, 2000), including a straightforward description of the method, common analytical techniques, the definition of relevant application areas and examples related to climate studies.
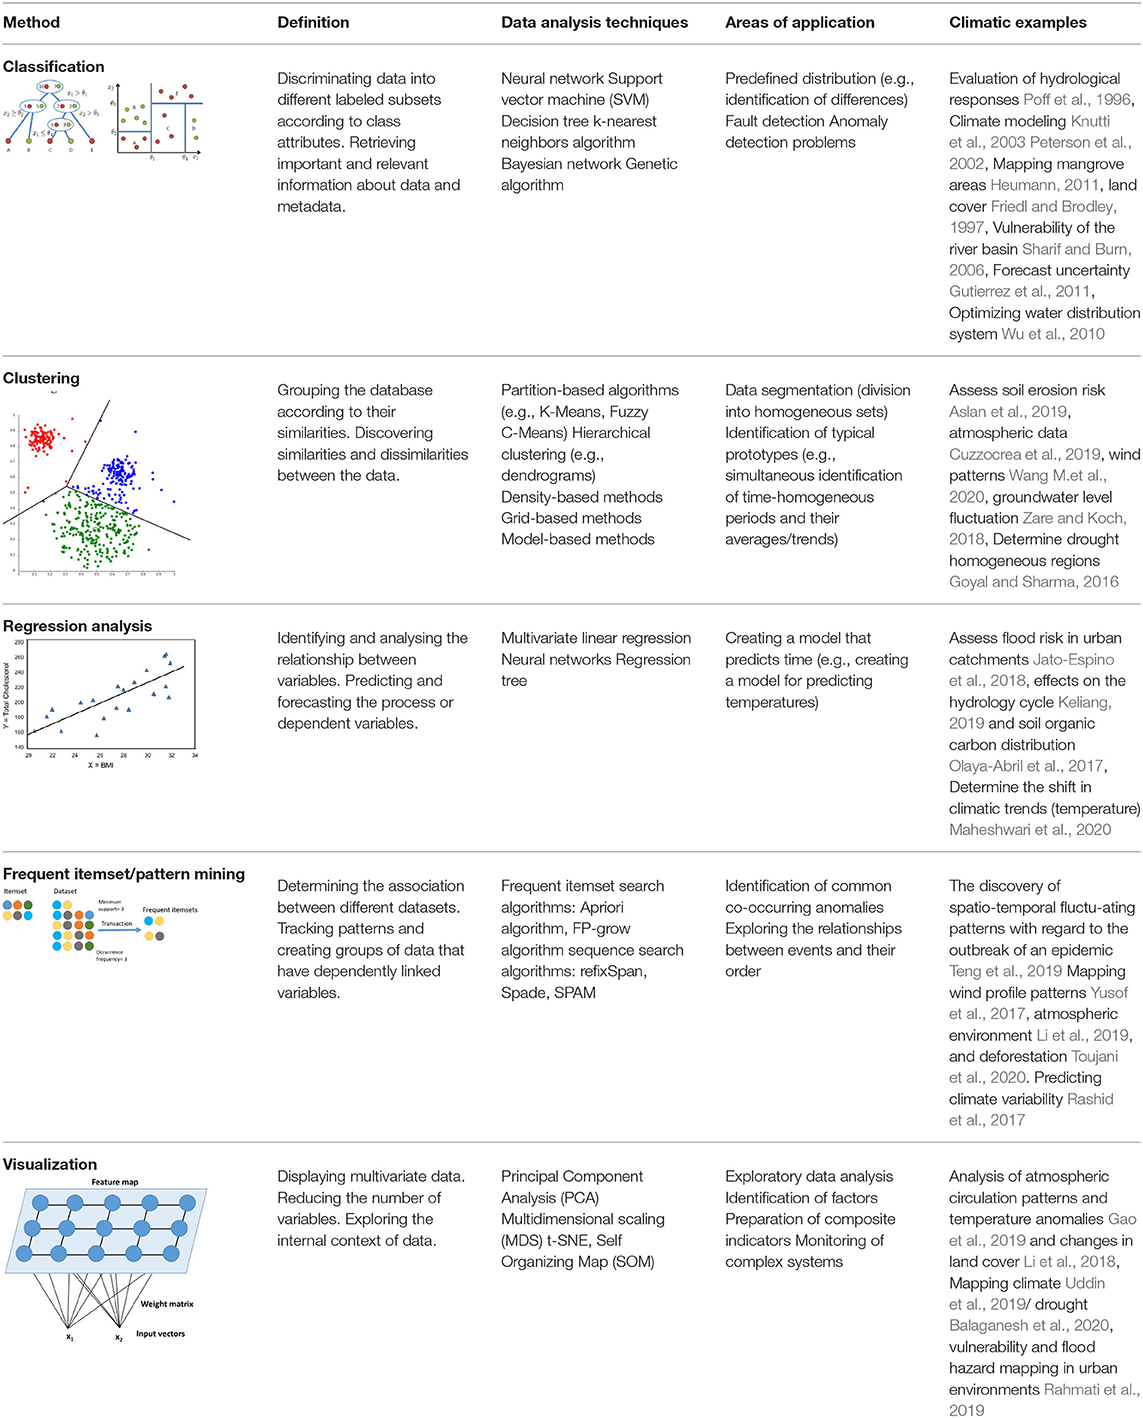
Table 1. Data mining techniques and areas of application.
Classification is fundamental in terms of data mining techniques (Zaki and Ho, 2000). Classification models define the similarity structure of the variables and are partitioned into groups (classes) (Aggarwal, 2015). In Big Data-based climate studies, classification models and techniques are greatly utilized. Two streams with different hydroclimatologies were studied in the United States using an artificial neural network (ANN). The analysis identified a large effect on a variety of factors such as average runoff, flow variability, flood frequency and baseline flow stability (Poff et al., 1996). To overcome the great uncertainties inherent in climate models, an alternative neural network-based climate model has been developed that increases the efficiency of large climate model sets by at least one order of magnitude. Based on this, it can be concluded that heating exceeds the surface heating range estimated by the IPCC for almost half of the members of the ensemble (Knutti et al., 2003). This neural network is an effective tool for dealing with such difficult and challenging problems, moreover, has been widely used to explore the mechanisms of climate change and predict trends is climate change that take full advantage of the unknown information hidden in climate data, however, it cannot decipher it.
General Circulation Models (GCMs)—the most advanced tools for estimating future climate change scenarios- operate on a coarse scale, which can be downscaled by support vector machine (SVM) approaches, training meteorological subdivisions (MSDs) and developing a downscaling model (DM) that has been shown to be better than conventional downscaling using multilayered regenerative artificial neural networks (Tripathi et al., 2006). The utilization of solar energy is evolving dynamically in connection with SDG 7, but power plant performance may fluctuate due to the diversity of meteorological conditions, which can be compensated by satellite imagery and SVM learning scheme to predict the motion vector of clouds (Jang et al., 2016). Object-based image analysis (OBIA) and support vector machine (SVM) combined with a decision-tree classification are suitable for mapping mangrove areas that was impossible by traditional remote sensing methods other than rough spatial resolution (Heumann, 2011). Decision tree algorithms consistently outperform maximum likelihood and linear discriminant function classifiers in terms of land cover mapping problems classification accuracy (Friedl and Brodley, 1997). Using a weather-generating model,which allows the nearest neighbor to be re-sampled by disturbing historical data, it is possible to create a set of climatic scenarios based on probable climatic scenarios to produce meteorological data that can be used to assess the vulnerability of the river basin to extreme events (Sharif and Burn, 2006). The ability of the Bayesian Network (BN) to predict long-term changes in the shoreline associated with rises in sea level and quantitatively estimate forecast uncertainty renders it suitable for research into the effects of climate change (Gutierrez et al., 2011). It has been used successfully to assess the effects of climate change disturbances on the structure of coral reefs (Franco et al., 2016) and in terms of belief updating concerning the reality of climate change in response to presenting information concerning the scientific consensus on anthropogenic global warming (AGW) (Cook and Lewandowsky, 2016). Using genetic algorithm and occurrence data from museum specimens, ecological niche models were developed for 1,870 species occurring in Mexico and projected onto two climatic surfaces modeled for 2055 (Peterson et al., 2002). A multi-objective genetic algorithm for optimizing water distribution systems (WDS) was used as a discovery tool to examine trade-offs between traditional economic goals and minimize greenhouse gas emissions (Wu et al., 2010). The European territory was subdivided into similar regions of predicted climate change based on simulations of total daily precipitation as well as recent (1986–2005) and long-term future (2081–2100) temperatures using K-mean cluster analysis (Carvalho et al., 2016). An automated procedure based on a cluster initialization algorithm is proposed and applied to changes in the 27 climatic extremes. The proposed method requires, on average, 40% fewer scenarios to meet the 90% threshold than k-means clustering (Cannon, 2015).
Clustering-based analyses are widely accepted data mining techniques, however, improvements in terms of time and cost savings are constantly required due to the management of an increasing amount of data (Shirkhorshidi et al., 2014). Regarding its usage in climatic analyses, a clustering-based spatio-temporal analysis framework of atmospheric data was developed to support both governmental and industrial decision-making processes (Cuzzocrea et al., 2019). To assess erosivity risk, clustering and classification analyses were applied on the national level in Turkey, moreover, an artificial neural network-based prediction was also made. The results identified an increasing risk of soil erosion in the southern and western regions of Turkey, which demands erosion control practices (Aslan et al., 2019). Research has been conducted to regionalize Europe according to similar surface temperatures based on data between 1986 and 2005. The differences between long-term predictive data (CMIP5) and historical data were analyzed with k-means clustering analyses to determine grid points (Carvalho et al., 2016). A fuzzy c-means approach regionalization was determined in western India for the analysis of meteorological drought homogeneous regions to provide effective support for water resources planning and management during droughts (Goyal and Sharma, 2016). Clustering techniques can support simulation and predict models by grouping large-scale data. “Wind energy production is expected to be affected by shifts in wind patterns that will accompany climate change.” In California, wind patterns have been clustered using model simulations from the variable-resolution Community Earth System Model (VR-CESM) and analyzed according to the change in the frequency of clusters and changes in winds within clusters. The changes in capacity factor have significant influence with regard to energy generation (Wang M. et al., 2020).
Regression analysis sought to reveal functional relationships between variables that can further support predictive and forecasting models. Urbanization tends to have a significant impact on climate change, as underlined by an Australian study which determined that changes in land use and vegetation as a result of shifts in urbanization that affect the local climate and water cycle as well as its impacts are considered to be local specific (Maheshwari et al., 2020). Multiple regression-based analysis has been used to determine flood risk in urban catchments by combining multiple linear regression, multiple nonlinear regression and multiple binary logistics regression. This framework sought to support action plans concerning drainage management and maximize the impacts of flood susceptibility strategic implementations (Jato-Espino et al., 2018). Regarding water management, the influence of climate change on the hydrological cycle in the Yangtze River Basin has been analyzed using a regression analysis model and geographic information system (Keliang, 2019). Soil plays a significant role in carbon sequestration, therefore, moderate undesired climatic effects. A model has been designed regarding the top 25 cm of topsoil of the Sierra Morena (Red Natura 2000) area to determine the relationship between independent variables and soil organic carbon (SOC), moreover, by the use of multiple linear regression analysis examined the effects of these variables on SOC content. The results indicated that “SOC in a future scenario of climate change depends on average temperature of coldest quarter (41.9%), average temperature of warmest quarter (34.5%), annual precipitation (22.2%), and annual average temperature (1.3%).” The comparison between the current (2016) and future situations reflects a reduction of 35.4% SOC content and a trend in northward migration (Olaya-Abril et al., 2017).
Frequent itemset/pattern mining is a commonly used technique to extract knowledge from databases. The handling of an increasing amount of heterogeneous data is becoming ever more difficult, therefore, “an efficient algorithm is required to mine the hidden patterns of the frequent itemsets within a shorter run time and with less memory consumption while the volume of data increases over the time period” (Chee et al., 2019). Association rule mining (ARM) models have been built for atmospheric environment monitoring based on the Apriori algorithm and D-S theory/ER algorithm. These techniques provide both technical and theoretical support to prevent as well as manage air pollution (Li et al., 2019). Association rule mining has also been used in terms of monitoring weather behavioral data to develop a prediction model for climate variability (Rashid et al., 2017). Furthermore, climate variability has an impact on agriculture, which demands a greater understanding with regard to the impact of the climate on crop production and food security. Therefore, the impact of seasonal rainfall on rice crop yield was determined based on ARM techniques (Gandhi and Armstrong, 2016). For the understanding of wind conditions, multidimensional sequential pattern mining is used that can define which pattern is suitable for wind energy (by taking into consideration the factors of space, time, and height). According to a study on the Netherlands, 68.97% of the country covered by a suitable wind pattern (at 128 m) and already has wind turbines installed (Yusof et al., 2017). A spatio-temporal pattern-based sequence classification framework was built to estimate the extent of deforestation. This approach was applied on a Tunisian case study that took into consideration 15 years of satellite images and historical wildfire GIS data (Toujani et al., 2020).
Visualization methods sought to explore the interconnections between data by simplifying multivariate data. Self-organizing map neural network (SOMN) method has been used to analyse anomalous atmospheric circulation patterns in China with regard to surface temperature anomalies between 1979 and 2017 (Gao et al., 2019). This method is greatly used for mapping changes, e.g., regarding urban flood hazards (Rahmati et al., 2019). A study on the city of Amol in Iran was conducted and according to the aforementioned model of urban flood hazard mapping, 23% of the land area of the city is expected to high or very high levels of flood risk, which demands efficient flood risk management. SOMN and grid cells method were applied to determine changes in spatio-temporal land cover in Inner Mongolia between 2004 and 2014 (Li et al., 2018). The Principal Component Analysis (PCA) technique has been used to assess the vulnerability of the coastal region of Bangladesh while taking into consideration the IPCC framework. The study used 31 indicators (24 socio-economic, 7 natural). PCA was applied and determined seven eigenvectors [Demographic Vulnerability (PC1), Economic Vulnerability (PC2), Agricultural Vulnerability (PC3), Water Vulnerability (PC4), Health Vulnerability (PC5), Climate Vulnerability (PC6), and Infrastructural Vulnerability (PC7)] that take into consideration climate change scenarios from 2013 to 2050 (Uddin et al., 2019). PCA has also been used to build the composite drought vulnerability index (Balaganesh et al., 2020).
4. Systematic Review of Climate Change-Related Analyses
4.1. Overview of Big Data-Based Climate Change Analysis
The significance of Big Data in climate-related studies is greatly recognized and its techniques are widely used to observe and monitor changes on a global scale. It facilitates understanding and forecasting to support adaptive decision-making as well as optimize models and structures (Hassani et al., 2019).
Review articles can provide a better organized structure of previous studies, so the major focus areas are determined with regard to previous review articles concerning the connection between climate change and Big Data. The major objective is to reveal how diverse disciplines appears in the related researches, therefore narrowing when and how Big Data applications and the relation with data science are appeared in climate studies.
A comprehensive overview was conducted based on the Scopus database. Fifty-seven articles were retrieved from the following search: [TITLE-ABS-KEY(“climate change”) AND TITLE-ABS-KEY(“Big Data”)] AND [TITLE-ABS-KEY(“overview”) OR TITLE-ABS-KEY(“review”)].
Articles were reviewed and selected individually for the final sample. Table 2 shows the number of articles selected and excluded.

Table 2. Selection of articles related to the review of climate data.
The 47 articles of the final sample are shown in Tables 3–5, where a straightforward description and focus area of the research are indicated as well as categorized accordingly. It is notable that mostly specific climate issues are observed (e.g., decarbonization of energy or land ecosystem) and their potential with regard to Big Data determined. The two most affected categories are agriculture and studies of sustainable cities and communities. This is a good illustration of how intertwined research on climate action is with sustainable development goals.
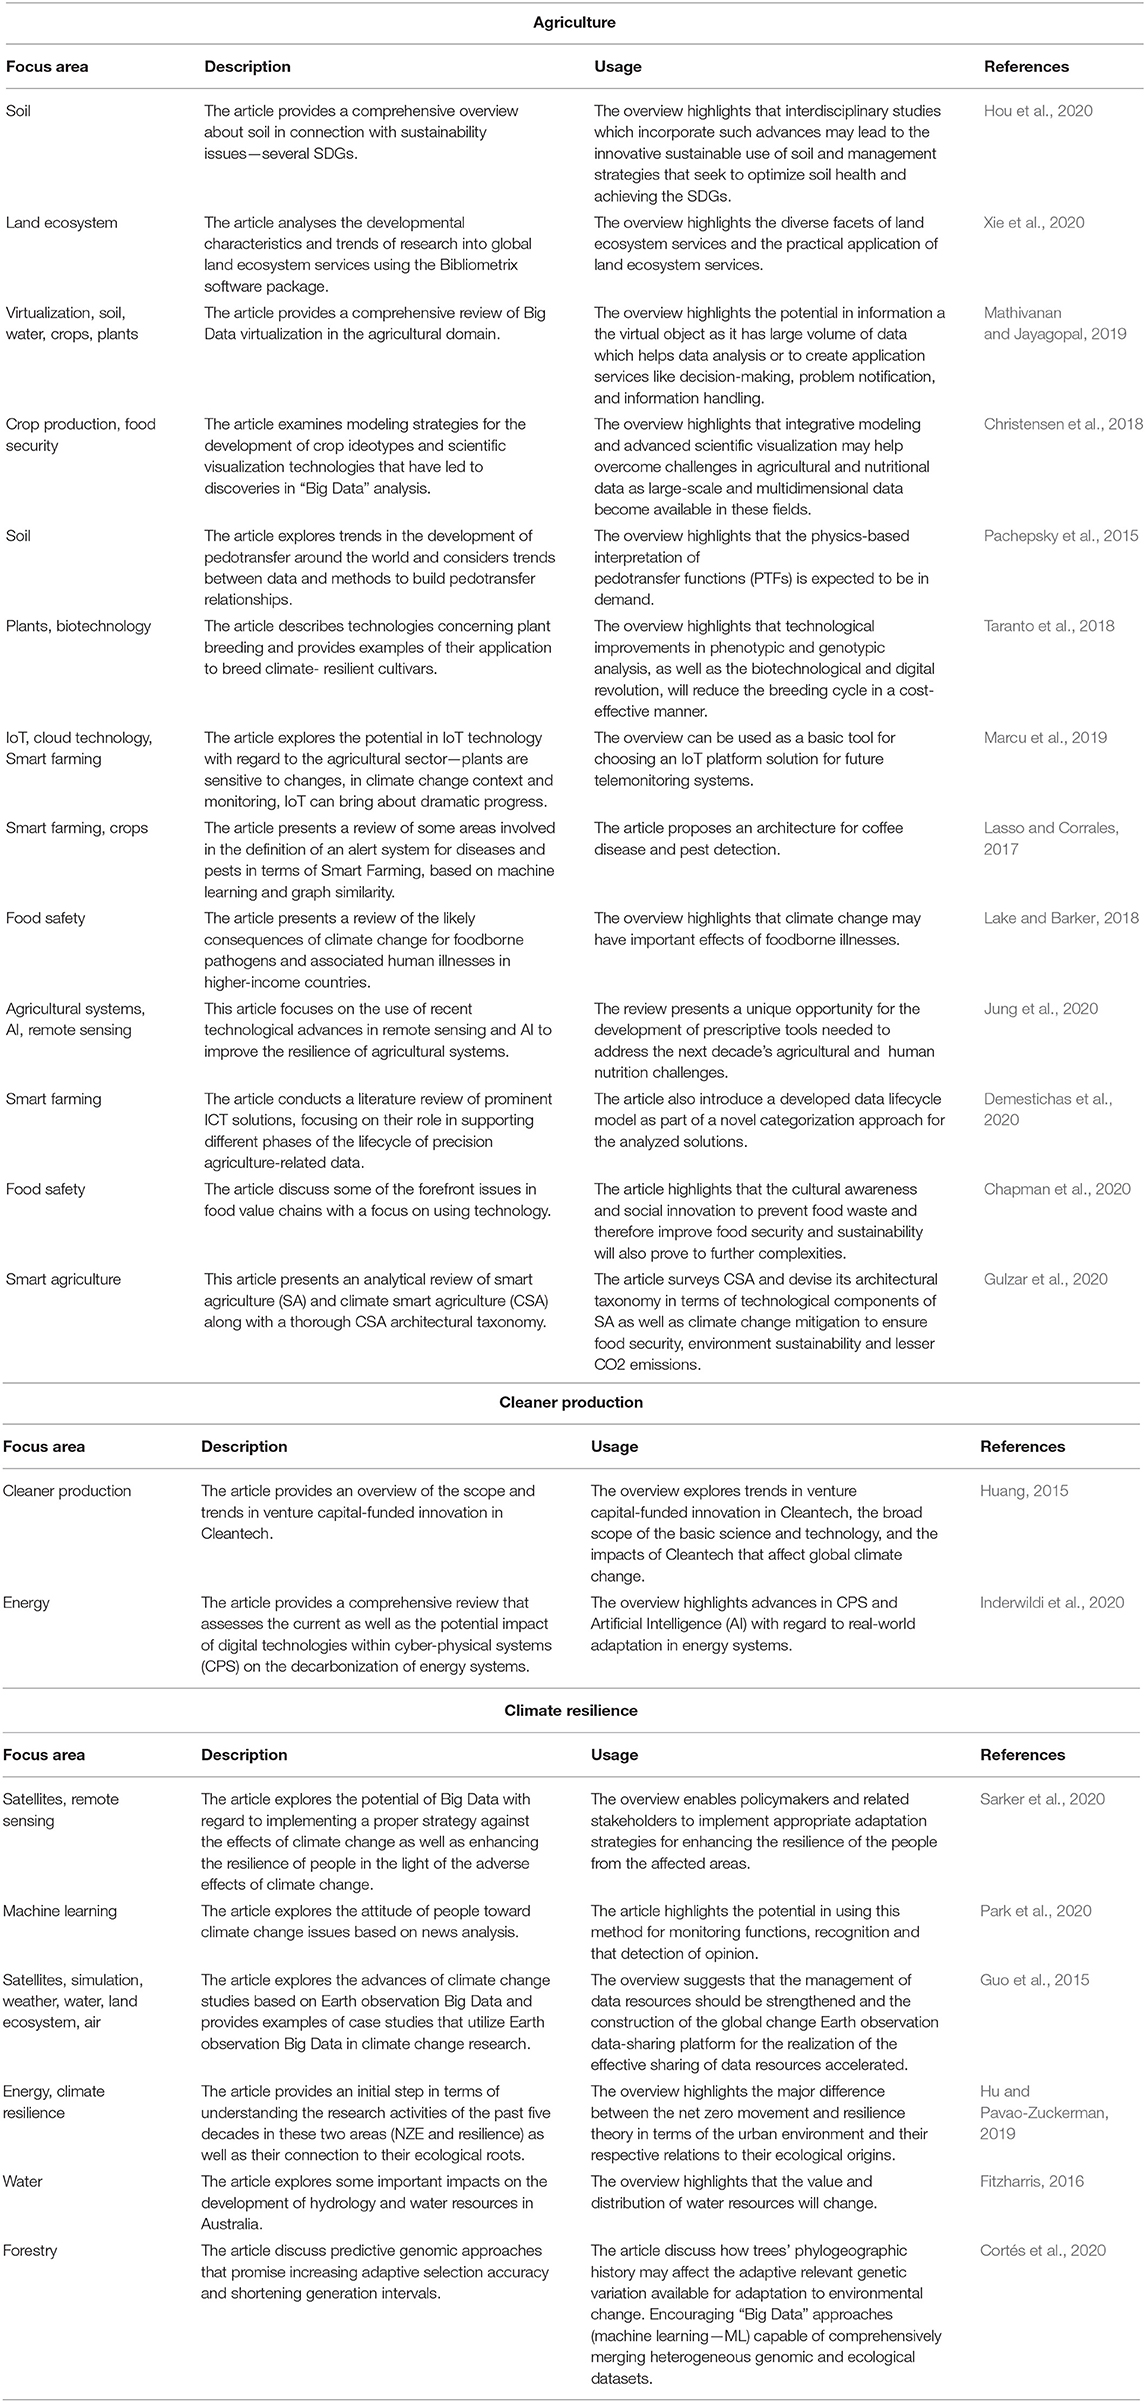
Table 3. Overview of articles analysing Big Data usage with climate change issues categorized into the domains of Agriculture, Cleaner production, and Climate resilience.
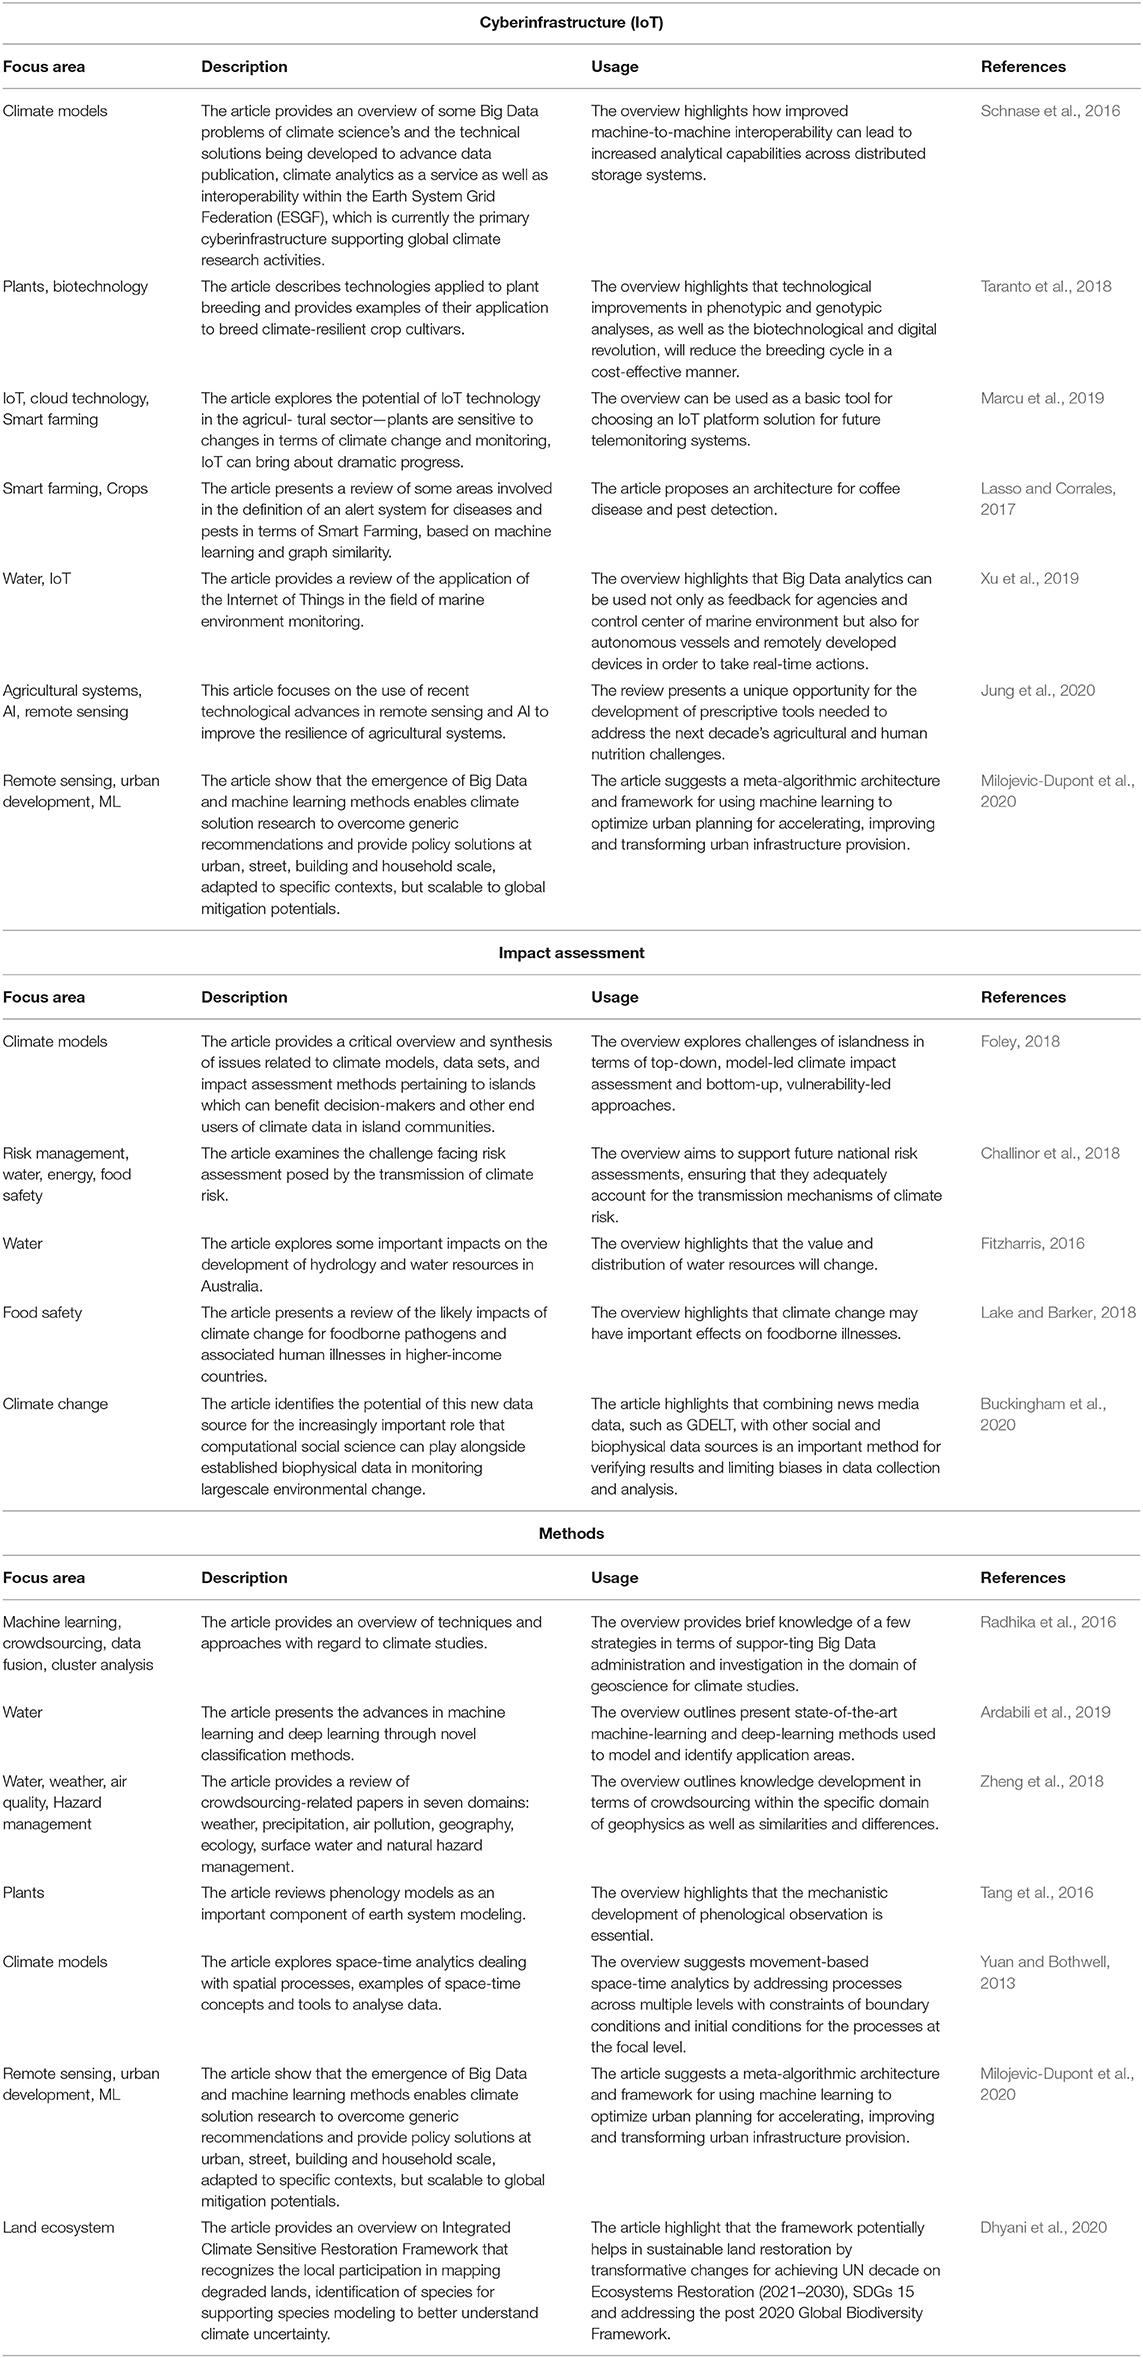
Table 4. Overview of articles analysing Big Data usage in terms of climate change issues categorized into the domains of Cyberinfrastructure (IoT), Impact assessment and Methods.
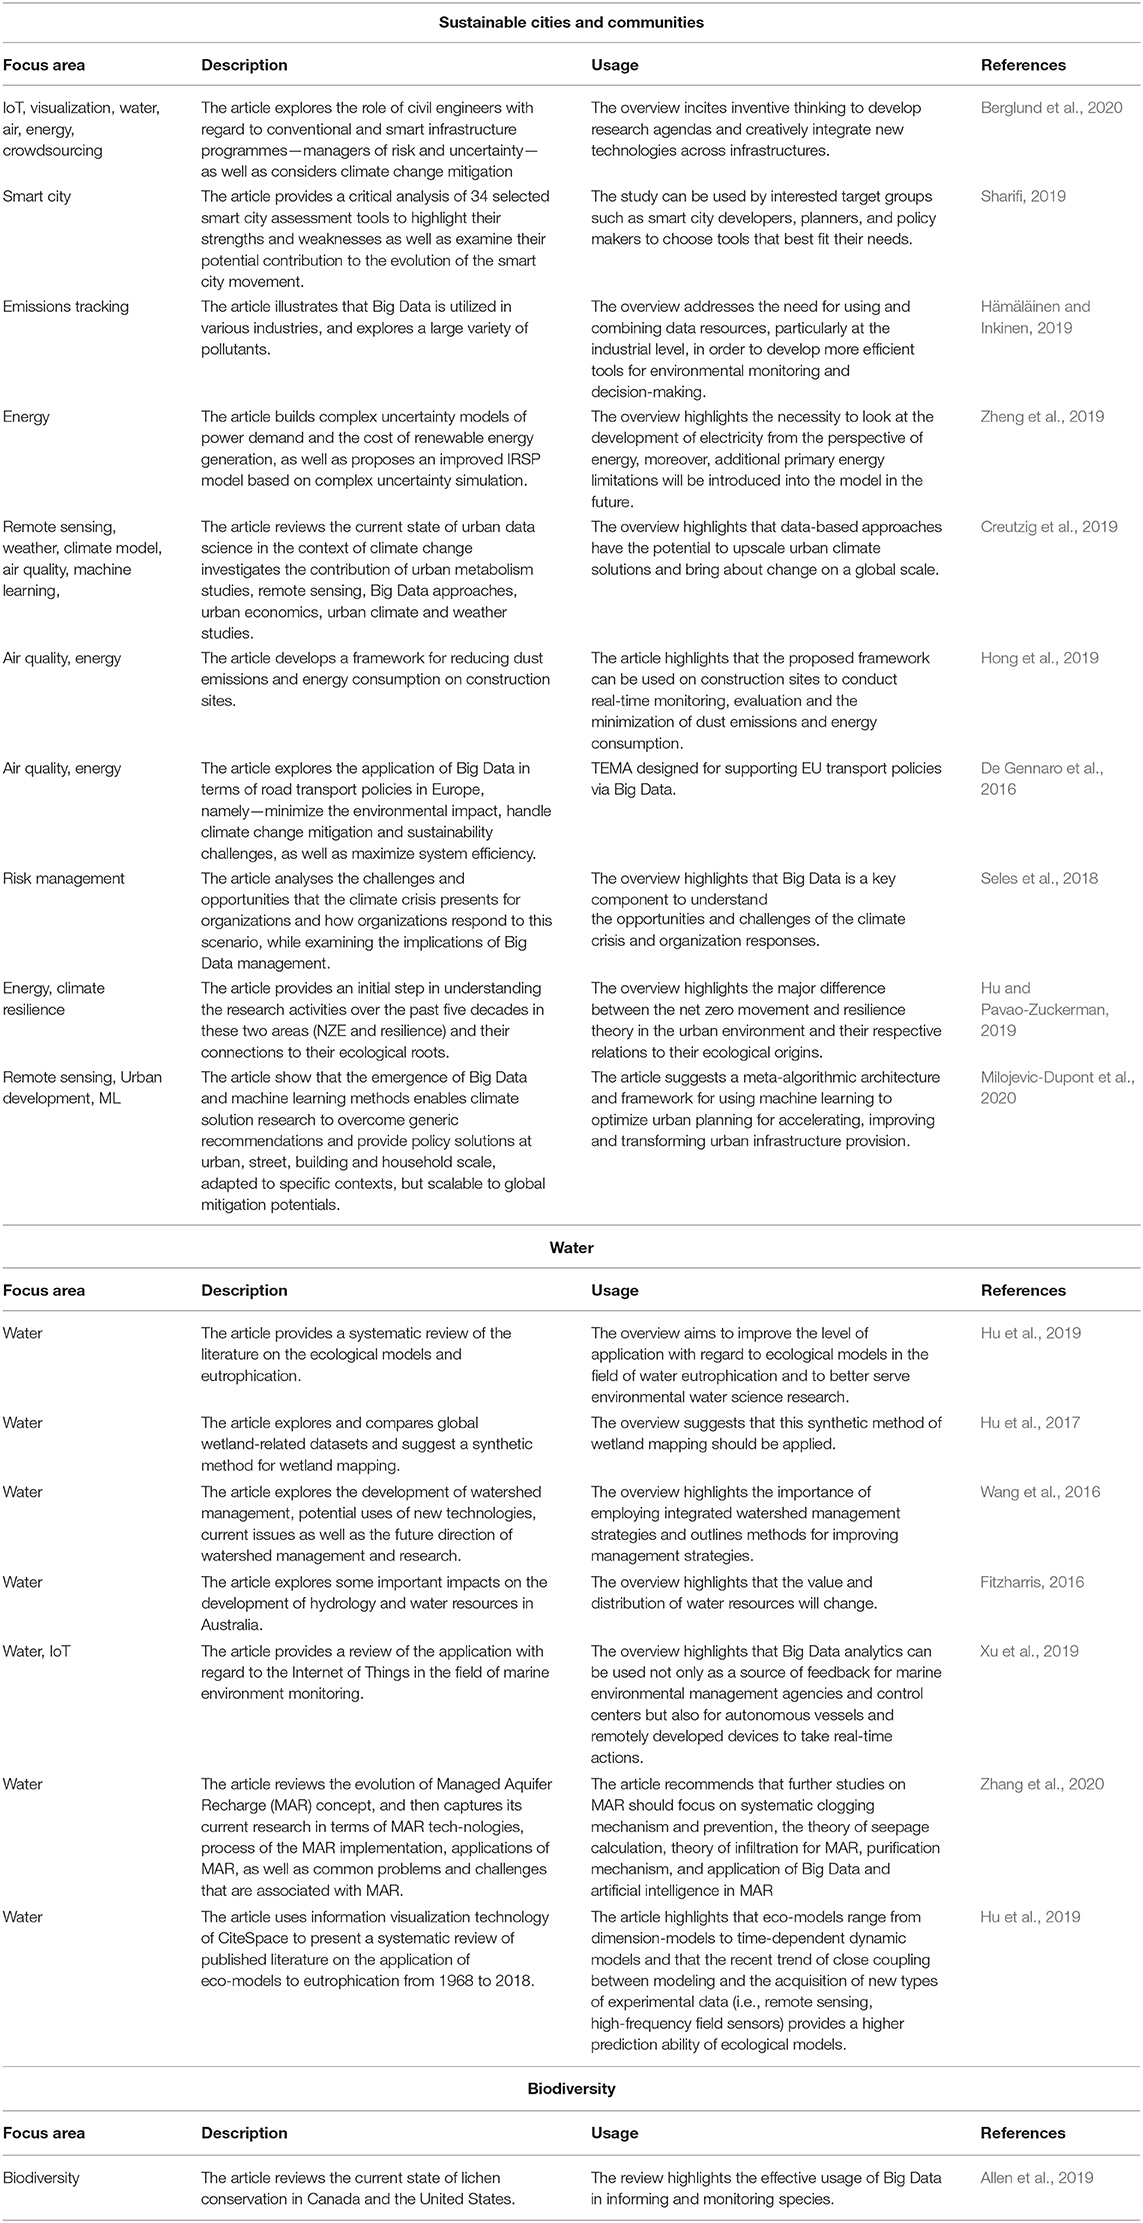
Table 5. Overview of articles analysing Big Data usage in terms of climate change issues categorized into the domains of Sustainable cities and communities, Water, and Biodiversity.
The quality and safety of agricultural products can be assured through solutions provided by the Internet of Things (IoT) and cloud computing (Marcu et al., 2019). Remote sensing and Artificial Intelligence technologies enables to integrate Big Data into predictive and prescriptive management tools, to improve e.g., the resilience of agricultural systems (Jung et al., 2020). Big Data virtualization in the field of agriculture enables physical objects to be virtualized, e.g., sensors and devices used for defining soil moisture, water flows, or salinity, where these objects can provide diverse meaningful information in each phase of a data chain to support decision-making and information handling (Mathivanan and Jayagopal, 2019). Furthermore, Big Data techniques are utilized in terms of plant breeding (Taranto et al., 2018), crop ideotypes for food security (Christensen et al., 2018), or in precision agriculture framework (Demestichas et al., 2020). Climate Smart Agriculture framework aims to enhance the capacity of the agricultural systems to support food security, supporting adaptation, and mitigation into sustainable agriculture development through latest technologies as IoT, AI, geo-informatics, and Big Data analytics (Gulzar et al., 2020). The interdisciplinary and systematic approach of soil use and management to achieve related sustainability goals has also been explored (Hou et al., 2020).
Alignment with regard to the focus area of sustainable cities and communities with the 11th sustainable development goal (Sustainable cities and communities) has been explored through reviews. Big Data management can enhance the opportunity for organizations to respond to the risk of climate change in time (Seles et al., 2018) as well as offers possibilities to consider sustainable production and lower emission rates. Furthermore, machine learning can be effectively utilized for low-carbon urban planning (Milojevic-Dupont et al., 2020). Outside the field of industry, co-operation, legislation, and environmental agreements are essential to realize a sustainable manufacturing environment (Hämäläinen and Inkinen, 2019). The concept of smart cities seeks to overcome and prevent climate change and issues concerning urbanization (Sharifi, 2019), moreover, smart transportation policies can utilize the advantages of Big Data (De Gennaro et al., 2016). In this smart environment, civil engineers are seen as future risk and uncertainty managers to improve community resilience through smart infrastructure programs (Berglund et al., 2020).
Climate resilience studies assess how to prepare for, recover from and adopt to climate-related risks (Center for Climate and Energy Solutions, 2019). Big Data seeks to support these activities by providing a large volume, variety, and quality data to reveal patterns and enables data democratization (Faghmous et al., 2014). Therefore, Big Data approach can serve as a source of key information for decision-makers in terms of creating and adapting appropriate strategies, determining current, and upcoming issues, as well as identifying stages of recovery for taking actions in time (Sarker et al., 2020). News media can serve as a near-real-time geolocated information, which can support the understanding of social movements and early-warning systems. “Combining news media with social and biophysical data is important to verify results and limit biases in analysis” (Buckingham et al., 2020). One of the issues concerning urban environments is energy efficiency and carbon emissions, for which net zero energy movements seek to bring about a solution as well as the application of a resilience ecological framework for net zero energy research (Hu and Pavao-Zuckerman, 2019). Furthermore, Big Data techniques with regard to machine learning enable the attitude of people toward and recognition of environmental changes to be determined (Park et al., 2020). Big Data and machine learning approaches are vital in comprehensively merging heterogeneous genomic and ecological datasets (Cortés et al., 2020).
However, review articles have explored the potential for utilizing Big Data techniques in diverse areas, moreover, comprehensive overviews about climate change are becoming less of a focus. Even though data-intensive research applications may seems to be unbalanced among disciplines (Hassani et al., 2019), the dynamism and complexity of climate issues must not be neglected. This complexity brings about an interdisciplinary approach and the intertwining of diverse disciplines, to which the System of Systems concept (climate computing) is the urgent answer.
4.2. Meta-Analysis With Regard to the Methods of Climate-Related Analyses
Co-word analysis examines the relationships between keywords to reveal the structure and development of methodologies or applications. The relationships between keywords in research papers “contains valuable information about knowledge structure of the field, its relevant concepts, and their connections” Lozano et al. (2019). It is our aim to determine diverse focus areas, methodologies and techniques regarding Big Data-driven climate change analyses and harmonize these to allow better utilization of the achieved field-specific results.
The Scopus database was used to identify the corresponding papers using the following search: [TITLE-ABS-KEY(“climate change”) AND TITLE-ABS-KEY(“Big Data”)]. As a result 442 articles were retrieved and the co-occurrence of their keywords analyzed using VOSviewer. The time period in which the papers were written was between the years 2012 and 2020. In Figure 3, seven clusters are indicated by a diverse range of colors that overarch topics related to climate change and application methods of Big Data.
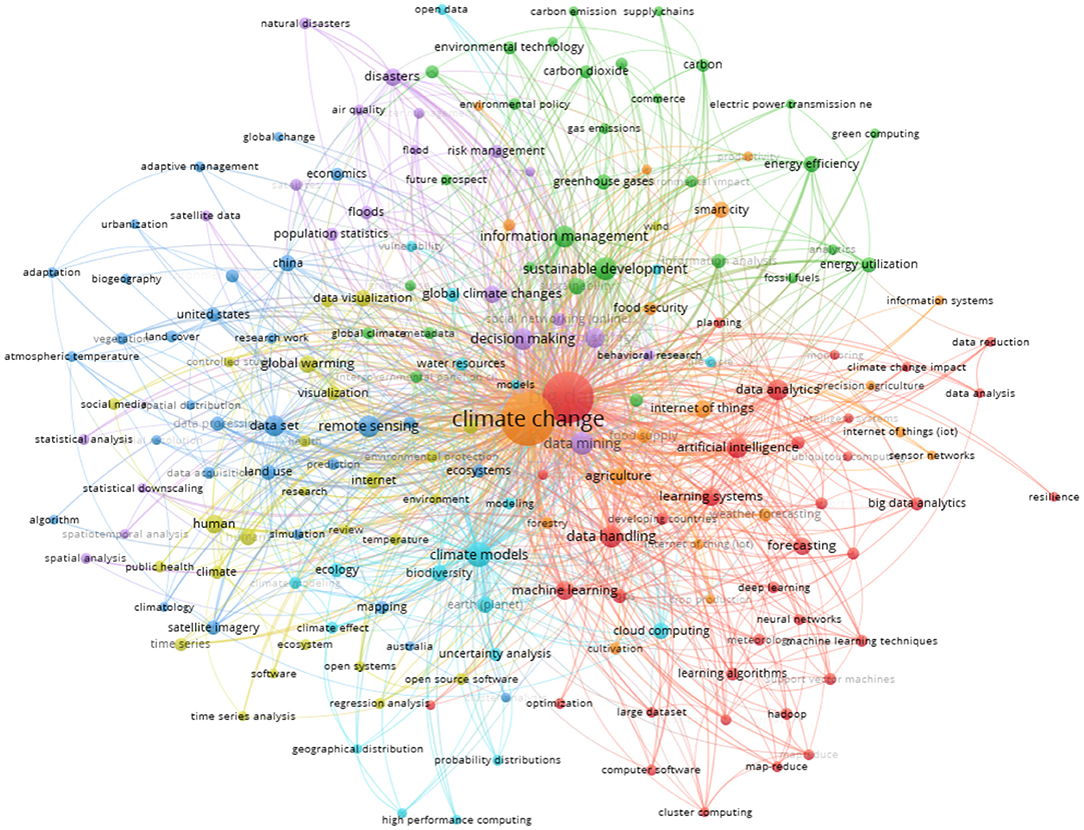
Figure 3. The network of keywords co-occurrence in climate-related Big Data articles.
Each cluster refers to a focus area including its attributes of interrelationships as well as methodologies and techniques applied in the field.
The “Red” cluster denotes the connections between Big Data technologies and methods applied for optimization procedures, measures the impact of climate change and resilience as well as makes predictions. Technologies are considered, e.g., artificial intelligence, learning algorithms such as machine learning and deep learning, data analytics, neural networks, and cluster computing. Neural networks are used to analyse climate change, weather prediction, and visualization (Buszta and Mazurkiewicz, 2015), while machine learning techniques are used for intelligent recognition (Demertzis and Iliadis, 2016) and to define the impact of climate change and resilience (Rolnick et al., 2019). In addition, they are used to predict epidemics and diseases in both social (Rees et al., 2019) and environmental contexts e.g., in the case of crops (Fenu and Malloci, 2019), coffee disease and pest (Lasso and Corrales, 2017), or pedotransfer functions (Benke et al., 2020). Clustering techniques on cloud computing infrastructure have been applied, e.g., to map changes in glaciers (Ayma et al., 2019). A novel machine learning approach has been developed by the U.S. Department of Energy’s National Renewable Energy Laboratory using adversarial training in climate forecasting, in which the model provides a “physics-informed variation to the super resolution generative adversarial network (SRGAN) model, which extends proven performance on super resolution of natural images to scientific datasets” (Stengel et al., 2019). This breakthrough is capable of saving computational time and data storage, moreover, can provide more accessible high-resolution climate data that can be utilized in a wide range of climate scenarios. These techniques seek to assess risk management in terms of human and environmental health by providing vital information concerning the present conditions and making predictions about the future.
Keywords included in the “orange” cluster, mainly describe agriculture-related climate issues and adaptations. IoT technologies, information systems and sensor networks tend to be applied in a field. Big Data increase the heterogeneity “across farms, farmers, climates, crops, soils, natural resources, models, management strategies and outcomes, post production value chain system, and other economic variables of interest” that can boost knowledge with regard to the concept of climate-smart agriculture (Rao, 2018). IoT technologies have been proven to be beneficial in improving efficiency in the complex field of agriculture. Sensors are used to collect vital information about soil, fertilizer, moisture, sunshine, temperature, and geographic information of farmland for monitoring as well as to link to other databases for identifying attributes (Yan-e, 2011). The combination of automation and IoT technologies broad perspectives in smart agriculture, as remote controlled robots to perform tasks, smart and intelligent decision making based on real time data as well as warehouse management (Gondchawar and Kawitkar, 2016).
The “purple” cluster represents natural disasters caused by climate change, e.g., floods or deteriorating air quality, and the related risk management. Decision-making processes are supported by data mining techniques and statistical as well as spatial analysis. The frequency of natural disasters in the Philippines increased by 147% from 1980 to 2012 and continues to rise (Garcia and Hernandez, 2017). Big Data through data mining plays a significant role in creating real-time feedback loops on natural disasters to support disaster management in prevention, protection, mitigation processes as well as response and recovery, moreover, in increasing the resilience of citizens (Yang et al., 2017).
“Light blue” clusters climate models that define interactions of the drivers of climate change. Topics like ecology, biodiversity, vulnerability, and the issue of water resources are included. Big Data-based techniques are widely used and the importance of open data must be recognized. Cloud computing and uncertainty analysis tend to support the modeling of life cycles and climatic effects. The open data science approach ensures a transparent and collaborative environment for multi-model climate change data analytics (Fiore et al., 2018). Information about the geographic distribution of greenhouse gas emissions can be useful in terms of high-resolution modeling (Charkovska et al., 2019).
The “green” cluster defines topics with regard to sustainable development, dealing with gas emissions, greenhouse gases, energy efficiency, and environmental policies. Information analytics and environmental technologies as well as green computing seek to minimize hazardous waste while maximizing energy efficiency and recyclability to foster the concept of a circular economy. Data mining, generic algorithms, and neural networks are gradually applied in sustainable consumption research, that enables more accurate and better visualized results (Wang et al., 2019). Managing efficient energy use is a commonly discussed issue that takes into consideration the climate change impact analysis with regard to the energy use of campus buildings (Fathi and Srinivasan, 2019), life-cycle assessment of energy-consuming products (Ross and Cheah, 2019) as well as the adaptation of green computing to reduce the carbon footprint of ICT (Airehrour et al., 2019).
The “blue” cluster seems to reveal methodologies considered in climatology, urbanization, and adaptive management. Remote sensing and satellite imagery make it possible to collect a large amount of data that supports mapping and is used to make further predictions. Satellite remote sensing quantifies processes and spatio-temporal states of the atmosphere, land, and oceans (Yang et al., 2013), moreover enables, for example, climate change and the impact of human activities on cropland productivity to be detected (Yan et al., 2020) and changes in water resources to be mapped (Senay et al., 2017). The monitoring of carbon by satellite observation provides information about greenhouse gases and emissions that can be utilized in estimation processes regarding the investigation of CO2 (Zhao et al., 2019).
The “yellow” cluster consists of the global climate change-related data analyses, visualization methods, regression analysis, and time series analysis. Open systems and open sources are gaining ever more attention in this field. A web-based visualization of complex climate data can assure scientists, resource managers, policymakers, and the public to explore climate-balance projections even at the local level (Alder and Hostetler, 2015). The assessment of spatiotemporal data to gain knowledge from it is a complex challenge, however, a well-developed visual analytical system can support performance improvement methods and techniques (Li et al., 2013). A high performance query analytical framework that proposes grid transformation can provide a complex climate data observation and model simulation (L et al., 2017). For climate environmental analyses, a 3D visualization simulation of cloud data is gaining attention in the fields of computer graphics and meteorology (Xie Y. et al., 2019).
The application of contemporary technologies like Big Data analytics and IoT-based models is sought to gain a knowledge base in any field by collecting and analysing large complex heterogeneous data sets. This enables evidence-based policy making to be encouraged and serves as a decision support tool for risk assessment and resilience adaptation, while forecasting future socio-economic as well as aiding environmental conditions caused by climate-related change. The Big Data researches are important in itself and contribute to the understanding of climate change, but managing their results in an integrated way increases the level of problem extraction and provides new solutions for decision makers.
4.3. The Role of Social Sciences in Climate Change Studies
Most articles on climate change belong to the field of environmental science, closely followed by Earth and planetary sciences, then agricultural and biological sciences. Interestingly, the number of articles published in the social sciences precedes the fields of engineering and energy.
The growing amount of information and knowledge renders multidisciplinary analyses covering the whole field of science and the development of such analytical tools indispensable as the knowledge accumulated cannot be directly utilized without systematization and targeted processing.
Climate change issues tend to connect different disciplines as well as research ideas, models, and solutions related to these issues. In the following, significant connection between climate and social sciences is discussed. The Scopus database was used to extract relevant information for meta-analysis.
The search for a connection with social sciences yielded 1,203 documents: [TITLE-ABS-KEY(“climate change”) AND TITLE-ABS-KEY(“social sciences”)]. The networks concerning the co-occurrence of keywords referring to the interrelationship between climate change and social sciences is shown in Figure 4.
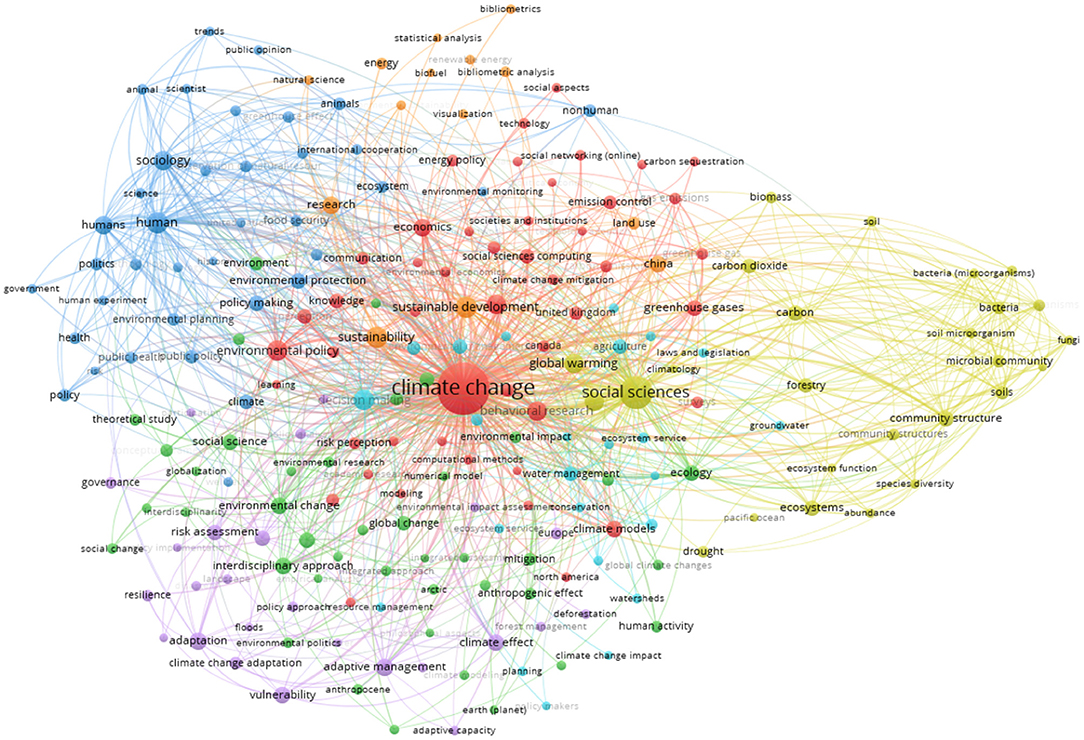
Figure 4. The relation between social sciences and climate change.
Based on the intersections presented in Figure 4, seven communities are detected. The red community includes emissions, energy and economic hubs. The yellow community includes habitat-related nodes. The light blue community covers regulators and issues concerning water management, while the purple community summarizes concepts related to “change,” e.g., vulnerability, adaptation, etc. The green community includes interdisciplinary subject areas, while the dark blue one represents political keywords and the orange community describes sustainable mergers.
A complex relationship exists between human and natural processes involving social, political, geographic, and cultural contexts that demands a multidisciplinary concept (Fiske et al., 2018). Environmental changes call for socio-economic transformation to mitigate the effects caused by humans and increase resilience. Changes are observed in a diverse range of areas such as agriculture and food security, air quality, waters, energy consumption, land ecosystem as well as global warming. These issues must be managed through strategic planning and management with a high degree of focus on long-term sustainable operation. Socio-ecological-economic models must integrate social and biophysical information in order to develop sufficient mitigation and adaptation strategies (Sullivan and Huntingford, 2009). The impact of climate change on water resources is critical as it is related to floods, droughts, tidal waves, and humidity. Big Data-based processes are used to determine, for example, soil conditions and humidity (Anton et al., 2019) to estimate energy consumption (Seyedzadeh et al., 2018) or greenhouse gas emissions (Hamrani et al., 2020) that enable optimal processes and interventions to be predicted. Decision support algorithms, models, and databases are used to provide evidence-base for policymaking and legislation (Aragona and De Rosa, 2019) as well as disaster management (Akter and Wamba, 2019). These can be considered at organizational (Kouloukoui et al., 2019), local (Giest, 2017), sub-national (Hsu et al., 2019), national (Iacobuta et al., 2018), or even global levels (Flato et al., 2014).
Socio-environmental sciences are sought to explore the systematic cause-effect relationship following the environmental impact of human induced climate change. By providing heterogeneous data and supportive models, positive changes can be achieved through interdisciplinary data-driven perceptions that contribute to a better understanding of the complex issue, monitor changes, support decision-making, and bring about in-time interventions.
4.4. The Importance of the System of Systems Approach
Climate change is one of the most significant global challenges that need to be managed. To resolve any of the climate change-related challenges, “it is essential to elicit and integrate knowledge across a range of systems, informing the design of solutions that take into account the complex and uncertain nature of the individual systems and their interrelationships” (Little et al., 2019). The system of system (SoS) framework enables to analyse the interdependencies between various systems (e.g., human, information, environmental, and physical systems), therefore provides a clear understanding of the complex nature of the issue (Fan and Mostafavi, 2019). The trends in data science and information technology (Tannahill and Jamshidi, 2014) supports the integration of various disciplines and research outcomes to represent a socio-environmental system holistically inform policy and decision-making processes (Iwanaga et al., 2020) , which can be referred as climate computing.
To highlight the importance of the application of the system of systems approach, the latest Big Data-based works in the field of climate change were reviewed, based on which we identified a SoS framework (Figure 5). In the network of applications, the nodes show the different researches, and the edges represent the relationships of the research results. The BigData applications have been grouped according to sustainable development goals, thus showing the possible scientific contributions with the other fields.
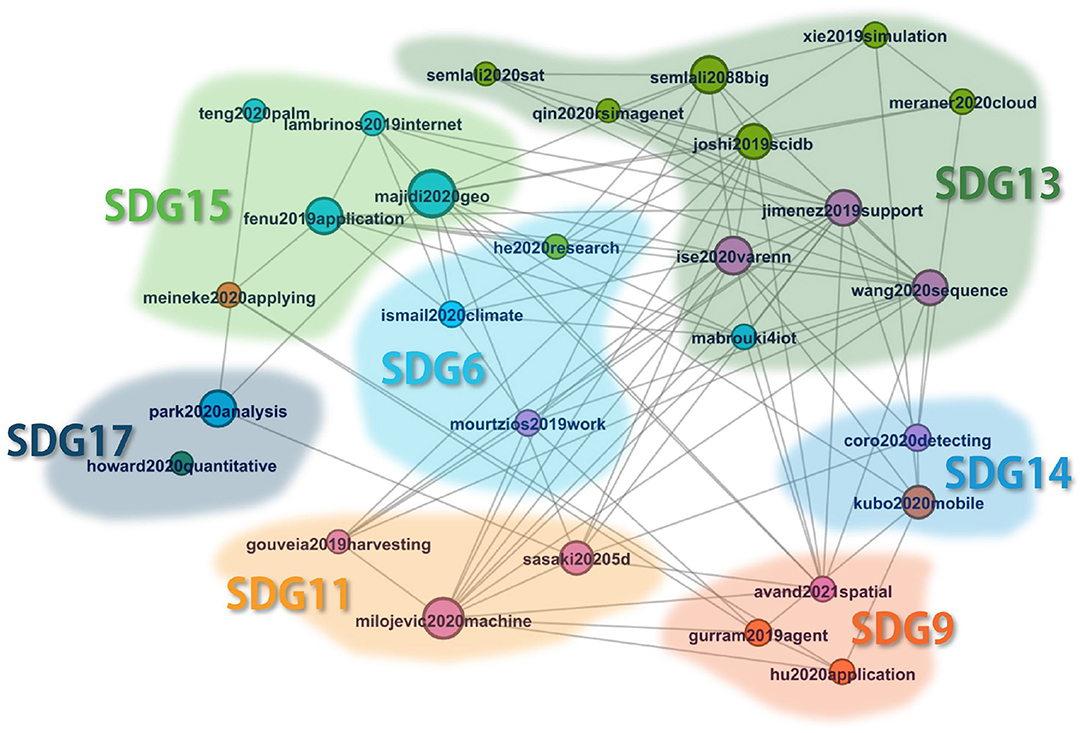
Figure 5. The system of systems concept of BigData applications.
By processing satellite data, the system developed in Semlali and El Amrani (2021) can monitor changes in air quality, which can also be used to monitor agricultural areas (Majidi et al., 2021). Cloud tracking (He et al., 2020) further helps to assess the evolution of air pollution, the reliability of which can be further enhanced with statistical downscaling solutions (Wang Q. et al., 2020). The time-series data (Joshi et al., 2019) extracted from satellite images support long-term forecasts, but the description of cloud motion (Xie Y. et al., 2019) can also be used to refine shorter-term analyzes. The use of satellite imagery as a data source in urban planning also helps identify climate-friendly solutions (Milojevic-Dupont et al., 2020).
Web-based water management (Mourtzios et al., 2021) can be supported with trends identified from time-series data (Ise et al., 2020), but remotely sensed water flow data also complements the agricultural water management model (Ismail et al., 2020). And if we increase the resolution of the data (Jimenez et al., 2019), we can also understand the causal relationships related to consumption. In terms of infrastructure load, patterns of population movement (Gurram et al., 2019) offer exciting opportunities, but can also be integrated with the condition of buildings (Gouveia and Palma, 2019), which also supports the satisfaction of urban planning tasks (Milojevic-Dupont et al., 2020) at a higher level.
Agricultural satellite imagery applications (Majidi et al., 2021) can be transferred to air quality satellite monitoring (Semlali and El Amrani, 2021), or time-series data (Ise et al., 2020) can be used to plan better agricultural interventions. By implication, satellite-based support plays an important role in modeling agricultural water management (Ismail et al., 2020), but disaster news (Park et al., 2020) also helps provide a deeper understanding of social involvement. In assessing disaster resilience in different areas, (Sasaki et al., 2020) satellite imagery provides feedback on risks that can even be revealed over time (Joshi et al., 2019). Satellite-based results can be supported by on-site special (Lambrinos, 2019) and meteorological (Mabrouki et al., 2021) sensor data, and flood protection of valuable agricultural areas can also be planned with flood models (Avand et al., 2021).
Identifying patterns in time-series data (Ise et al., 2020) helps with research in many other areas, whether it is agricultural water management (Ismail et al., 2020) or marine habitat protection (Coro et al., 2020). It allows (Kubo et al., 2020) forecasting and a better understanding of coastal traffic and increases the reliability of disaster resilience estimation (Sasaki et al., 2020). By extracting time series data (Joshi et al., 2019) from satellite imagery, we can indirectly validate the models by comparing the time series or identify the factors of potato disease (Fenu and Malloci, 2019). In urban developments (Milojevic-Dupont et al., 2020) and in building condition surveys (Gouveia and Palma, 2019) the forecast shows the development of infrastructure expansion and maintenance, to which the probability of flood protection problems (Avand et al., 2021) can also be linked.
Statistical downscaling (Wang Q. et al., 2020) helps to find the external variables of Mourtzios et al. (2021) consumption patterns identified based on remote sensing and is comparable with the results of satellite image-based analyzes (Semlali and El Amrani, 2021). And comparable to other approaches (Jimenez et al., 2019), which strengthens confidence in the models (Qin and Chi, 2020). Better resolution data supports marine habitat protection planning (Coro et al., 2020), risk assessment input (Fenu and Malloci, 2019), but can also be used (Gouveia and Palma, 2019) to analyze building consumption data. The efficiency of downscaling techniques can be increased with the Internet of Things (Lambrinos, 2019) toolbar. The increase of the number of observations allows a more accurate description of local climatic conditions to estimate floods (Avand et al., 2021) and heat island effects, as well as other sustainable urban planning (Milojevic-Dupont et al., 2020) aspects.
Coastal tourism monitoring (Kubo et al., 2020) can be integrated with traffic data (Hu et al., 2020) to optimize traffic management and thereby reduce pollutant emissions. The effect of transport on plant damage can be included (Meineke et al., 2020) as a factor to be analyzed, or we can use it (Gurram et al., 2019) to identify patterns in population movement.
Population movements (Gurram et al., 2019) affect water consumption (Mourtzios et al., 2021), can damage plants (Meineke et al., 2020), show the popularity of coastal areas (Kubo et al., 2020), but are also suitable for improving transport planning (Hu et al., 2020). Because the movement of residents is closely related to the infrastructure (Milojevic-Dupont et al., 2020), it is a very valuable input in urban planning.
The data of the Internet of Things sensors (Mabrouki et al., 2021) allow the conclusions drawn from the satellite images to be verified (Majidi et al., 2021), as a measuring station (Jimenez et al., 2019) increases the number of observations, thus better downscaling solutions (Wang Q. et al., 2020) can be made. It can be used for causal exploration of plant morphological damage (Fenu and Malloci, 2019) and supports agricultural irrigation water demand planning (Ismail et al., 2020), but can also be imported into flood models (Avand et al., 2021).
In the Big Data application, that supports the energy demand management of buildings (Gouveia and Palma, 2019), we can use water consumption data (Mourtzios et al., 2021) as an extension, development alternatives can be ranked based on time series data (Ise et al., 2020), or based on time series extracted from satellite images (Joshi et al., 2019), which can be supported by a deeper understanding of energy demand downscaled data (Wang Q. et al., 2020), because the resolution of the input data can be improved (Jimenez et al., 2019).
Based on the presented system of systems framework, it can be seen how the new results of Big Data applications related to climate change contribute to other areas. Remote sensing of water consumption (Mourtzios et al., 2021), analysis of cloud water content (He et al., 2020), and the agricultural water management model (Ismail et al., 2020) contribute to the goal of clean water and sanitation (SDG6). Planning based on the analysis of traffic data (Hu et al., 2020), studying population movements (Gurram et al., 2019) and flooding models (Avand et al., 2021) support the goal of industry, innovation and infrastructure (SDG9). Climate-friendly urban planning (Milojevic-Dupont et al., 2020), monitoring the energy demand of buildings (Gouveia and Palma, 2019), and defining disaster resilience (Sasaki et al., 2020) play an important role in achieving sustainable cities and communities (SDG11). The Climate Action goal (SDG13) tackles most data gaps, so research such as linking satellite images to Semlali and El Amrani (2021) with air quality, preprocessing them (Meraner et al., 2020; Qin and Chi, 2020; Semlali et al., 2020), the analysis of time series data (Ise et al., 2020) and its exploration (Joshi et al., 2019), downscaling (Wang Q. et al., 2020) techniques, enrichment of precipitation and temperature data (Jimenez et al., 2019), tracking the movement of clouds (Xie Y. et al., 2019), or just using IoT sensors (Mabrouki et al., 2021) are all key in creating a strategy to support the achievement of the climate goal. For the sustainability of life below water (SDG14), marine life prediction models (Coro et al., 2020) and human coastal activity (Kubo et al., 2020) can be integrated. Of course, the goal of life on land (SDG15) also requires new research, where a satellite-based study of agriculture and forestry (Majidi et al., 2021), deployment of IoT sensors (Lambrinos, 2019), analysis of climatic factors of potato damage (Fenu and Malloci, 2019), studying the morphology of plants (Meineke et al., 2020), or social media based illustration of palm oil consumption (Teng et al., 2020) are promising. Partnerships for the goals (SDG17) is critical in several ways, on the one hand we recommend the grouping of climate services (Howard et al., 2020), which fits the SoS concept we propose, and on the other hand we need to integrate the knowledge and give feedback to society. An exciting tool for measuring the effectiveness of climate and sustainability related measures is the analysis of news comments (Park et al., 2020).
It is essential to highlight that Big Data research on climate change can be used in other areas and as shown by the SDG grouping in Figure 5. Thus, based on the recommended SoS viewpoint, the specific results of sustainability-related research and development projects can be integrated, enhancing knowledge accumulation and utilization.
5. Discussion
This paper described the essential need for research and development objectives to realize and manage the complex issues of climate change through Big Data tools. Data-driven applications were reviewed through the co-occurrence analysis of keywords, which showed the widespread application of Big Data technologies and tools, however, comprehensively utilized and integrative analyses are less prevalent.
This research aimed to highlight the perspective of systems of systems (SoS) as the drivers and effects of climate as well as that their resilience and adaptation cannot be determined without the exploration of the synergies between new research trends and disciplines. Based on the recommended SoS viewpoint, the specific results of sustainability-related research and development projects can be integrated, enhancing knowledge accumulation and utilization. The tools of data and systems sciences can play a crucial role in recognition of climate challenges and mitigation opportunities thanks to the integration of heterogeneous data and models, and the exploration of the relationship between environmental and social factors. This integrated thinking lays the groundwork for promising future trends in climate computing.
It can be claimed that the exclusive analysis of climatic factors cannot bring about sufficient strategic adaptation by itself, rather the socio-environmental factors must be integrated the climate change models.
Mitigating the impacts of climate change and successful adaptation requires effective climate change strategic planning by countries worldwide whose decision-making requires complex models and sources of information. The Big Data toolkit enables the systematization, processing, and evaluation of heterogeneous data and information sources, which is unfeasible with traditional disciplinary analysis tools. The harmonization of the ever-expanding scientific knowledge and diversified data sources related to climate change may be one of the most urgent tasks for researchers in the future. This research presented Big Data analytics tools and their contribution toward exploring the characteristics of climate change as well as climate action-related counterparts such as sustainability and social sciences that are essential for the successful development and implementation of strategies.
Author Contributions
VS: conceptualization, validation, investigation, writing-original draft, visualization. JA: conceptualization, validation, resources, writing-review and editing, supervision, and funding acquisition. TC: writing-original draft, investigation, visualization, and validation. All authors contributed to the article and approved the submitted version.
Funding
This research was funded by the National Laboratory for Climate Change (NKFIH-872 project). We acknowledge the financial support of Széchenyi 2020 under the GINOP-2.3.2-15-2016-00016.
Conflict of Interest
The authors declare that the research was conducted in the absence of any commercial or financial relationships that could be construed as a potential conflict of interest.
References
Airehrour, D., Cherrington, M., Madanian, S., and Singh, J. (2019). “Reducing ICT carbon footprints through adoption of green computing,” in Proceedings of the IE 2019 International Conference (IE 2019), ed F. G. Filip (Bucharest), 257–263.
Akter, S., and Wamba, S. F. (2019). Big data and disaster management: a systematic review and agenda for future research. Ann. Oper. Res. 283, 939–959. doi: 10.1007/s10479-017-2584-2
Alder, J. R., and Hostetler, S. W. (2015). Web based visualization of large climate data sets. Environ. Model. Softw. 68, 175–180. doi: 10.1016/j.envsoft.2015.02.016
Allen, J. L., McMullin, R. T., Tripp, E. A., and Lendemer, J. C. (2019). Lichen conservation in North America: a review of current practices and research in Canada and the United States. Biodivers. Conserv. 28, 3103–3138. doi: 10.1007/s10531-019-01827-3
Anton, C. A., Matei, O., and Avram, A. (2019). “Collaborative data mining in agriculture for prediction of soil moisture and temperature,” in Computer Science On-Line Conference (Cham: Springer), 141–151. doi: 10.1007/978-3-030-19807-7_15
Aragona, B., and De Rosa, R. (2019). Big data in policy making. Math. Popul. Stud. 26, 107–113. doi: 10.1080/08898480.2017.1418113
Ardabili, S., Mosavi, A., Dehghani, M., and Várkonyi-Kóczy, A. R. (2019). “Deep learning and machine learning in hydrological processes climate change and earth systems a systematic review,” in International Conference on Global Research and Education (Cham: Springer), 52–62. doi: 10.1007/978-3-030-36841-8_5
Aslan, Z., Erdemir, G., Feoli, E., Giorgi, F., and Okcu, D. (2019). Effects of climate change on soil erosion risk assessed by clustering and artificial neural network. Pure Appl. Geophys. 176, 937–949. doi: 10.1007/s00024-018-2010-y
Avand, M., Moradi, H. R., and Ramazanzadeh Lasboyee, M. (2021). Spatial prediction of future flood risk: an approach to the effects of climate change. Geosciences 11:25. doi: 10.3390/geosciences11010025
Ayma, V., Beltrán, C., Happ, P., Costa, G., and Feitosa, R. (2019). Mapping glacier changes using clustering techniques on cloud computing infrastructure. Int. Arch. Photogr. Remote Sens. Spat. Inform. Sci. 29–34. doi: 10.5194/isprs-archives-XLII-2-W16-29-2019
Balaganesh, G., Malhotra, R., Sendhil, R., Sirohi, S., Maiti, S., Ponnusamy, K., et al. (2020). Development of composite vulnerability index and district level mapping of climate change induced drought in Tamil Nadu, India. Ecol. Indic. 113:106197. doi: 10.1016/j.ecolind.2020.106197
Benjelloun, F.-Z., Lahcen, A. A., and Belfkih, S. (2015). “An overview of big data opportunities, applications and tools,” in 2015 Intelligent Systems and Computer Vision (ISCV) (Fez), 1–6. doi: 10.1109/ISACV.2015.7105553
Benke, K., Norng, S., Robinson, N., Chia, K., Rees, D., and Hopley, J. (2020). Development of pedotransfer functions by machine learning for prediction of soil electrical conductivity and organic carbon content. Geoderma 366:114210. doi: 10.1016/j.geoderma.2020.114210
Berglund, E. Z., Monroe, J. G., Ahmed, I., Noghabaei, M., Do, J., Pesantez, J. E., et al. (2020). Smart infrastructure: a vision for the role of the civil engineering profession in smart cities. J. Infrastruct. Syst. 26:03120001. doi: 10.1061/(ASCE)IS.1943-555X.0000549
Bertot, J. C., Gorham, U., Jaeger, P. T., Sarin, L. C., and Choi, H. (2014). Big data, open government and e-government: issues, policies and recommendations. Inform. Pol. 19, 5–16. doi: 10.3233/IP-140328
Bibri, S. E. (2018). The iot for smart sustainable cities of the future: an analytical framework for sensor-based big data applications for environmental sustainability. Sustain. Cities Soc. 38, 230–253. doi: 10.1016/j.scs.2017.12.034
Buckingham, K., Brandt, J., Anderson, W., and Singh, R. (2020). The untapped potential of mining news media events for understanding environmental change. Curr. Opin. Environ. Sustain. 45, 92–99. doi: 10.1016/j.cosust.2020.08.015
Buszta, A., and Mazurkiewicz, J. (2015). “Climate changes prediction system based on weather big data visualisation,” in International Conference on Dependability and Complex Systems (Cham: Springer), 75–86. doi: 10.1007/978-3-319-19216-1_8
Cannon, A. J. (2015). Selecting gcm scenarios that span the range of changes in a multimodel ensemble: application to cmip5 climate extremes indices. J. Clim. 28, 1260-1267. doi: 10.1175/JCLI-D-14-00636.1
Carvalho, M. P., Melo-Gonçalves Teixeira, J., and Rocha, A. (2016). Regionalization of Europe based on a k-means cluster analysis of the climate change of temperatures and precipitation. Phys. Chem. Earth Parts A/B/C 94, 22–28. doi: 10.1016/j.pce.2016.05.001
Center for Climate and Energy Solutions (2019). What Is Climate Resilience and Why Does It Matter? Center for Climate and Energy Solutions.
Challinor, A. J., Adger, W. N., Benton, T. G., Conway, D., Joshi, M., and Frame, D. (2018). Transmission of climate risks across sectors and borders. Philos. Trans. R. Soc. A Math. Phys. Eng. Sci. 376:20170301. doi: 10.1098/rsta.2017.0301
Chapman, J., Power, A., Netzel, M. E., Sultanbawa, Y., Smyth, H. E., Truong, V. K., et al. (2020). Challenges and opportunities of the fourth revolution: a brief insight into the future of food. Crit. Rev. Food Sci. Nutr. 1–9. doi: 10.1080/10408398.2020.1863328
Charkovska, N., Horabik-Pyzel, J., Bun, R., Danylo, O., Nahorski, Z., Jonas, M., et al. (2019). High-resolution spatial distribution and associated uncertainties of greenhouse gas emissions from the agricultural sector. Mitigat. Adapt. Strat. Glob. Change 24, 881–905. doi: 10.1007/s11027-017-9779-3
Chee, C.-H., Jaafar, J., Aziz, I. A., Hasan, M. H., and Yeoh, W. (2019). Algorithms for frequent itemset mining: a literature review. Artif. Intell. Rev. 52, 2603–2621. doi: 10.1007/s10462-018-9629-z
Chen, H., Chiang, R. H., and Storey, V. C. (2012). Business intelligence and analytics: from big data to big impact. MIS Quart. 36, 1165–1188. doi: 10.2307/41703503
Christensen, A., Srinivasan, V., Hart, J. C., and Marshall-Colon, A. (2018). Use of computational modeling combined with advanced visualization to develop strategies for the design of crop ideotypes to address food security. Nutr. Rev. 76, 332–347. doi: 10.1093/nutrit/nux076
Clarke, A., and Margetts, H. (2014). Governments and citizens getting to know each other? Open, closed, and big data in public management reform. Policy Intern. 6, 393–417. doi: 10.1002/1944-2866.POI377
Climate Change (2014). Climate Change 2013: The Physical Science Basis: Working Group I Contribution to the Fifth Assessment Report of the Intergovernmental Panel on Climate Change. Cambridge University Press.
Constantiou, I. D., and Kallinikos, J. (2015). New games, new rules: big data and the changing context of strategy. J. Inform. Technol. 30, 44–57. doi: 10.1057/jit.2014.17
Cook, J., and Lewandowsky, S. (2016). Rational irrationality: modeling climate change belief polarization using Bayesian networks. Top. Cogn. Sci. 8, 160–179. doi: 10.1111/tops.12186
Coro, G., Pagano, P., and Ellenbroek, A. (2020). Detecting patterns of climate change in long-term forecasts of marine environmental parameters. Int. J. Digital Earth 13, 567–585. doi: 10.1080/17538947.2018.1543365
Cortés, J., Restrepo-Montoya, M., and Bedoya-Canas, L. E. (2020). Modern strategies to assess and breed forest tree adaptation to changing climate. Front. Plant Sci. 11:1606. doi: 10.3389/fpls.2020.583323
Craglia, M., Hradec, J., Nativi, S., and Santoro, M. (2017). Exploring the depths of the global earth observation system of systems. Big Earth Data 1, 21–46. doi: 10.1080/20964471.2017.1401284
Creutzig, F., Lohrey, S., Bai, X., Baklanov, A., Dawson, R., Dhakal, S., et al. (2019). Upscaling urban data science for global climate solutions. Glob. Sustain. 2. doi: 10.1017/sus.2018.16
Cuzzocrea, A., Gaber, M. M., Fadda, E., and Grasso, G. M. (2019). An innovative framework for supporting big atmospheric data analytics via clustering-based spatio-temporal analysis. J. Ambient Intell. Human. Comput. 10, 3383–3398. doi: 10.1007/s12652-018-0966-1
De Gennaro, M., Paffumi, E., and Martini, G. (2016). Big data for supporting low-carbon road transport policies in Europe: applications, challenges and opportunities. Big Data Res. 6, 11–25. doi: 10.1016/j.bdr.2016.04.003
Demertzis, K., and Iliadis, L. (2016). “Adaptive elitist differential evolution extreme learning machines on big data: intelligent recognition of invasive species,” in INNS Conference on Big Data (Cham: Springer), 333–345. doi: 10.1007/978-3-319-47898-2_34
Demestichas, K., and Daskalakis, E. (2020). Data lifecycle management in precision agriculture supported by information and communication technology. Agronomy 10:1648. doi: 10.3390/agronomy10111648
Dhyani, S., Bartlett, D., Kadaverugu, R., Dasgupta, R., Pujari, P., and Verma, P. (2020). Integrated climate sensitive restoration framework for transformative changes to sustainable land restoration. Restor. Ecol. 28, 1026–1031. doi: 10.1111/rec.13230
Di Gregorio, M., Fatorelli, L., Paavola, J., Locatelli, B., Pramova, E., Nurrochmat, D. R., et al. (2019). Multi-level governance and power in climate change policy networks. Glob. Environ. Change 54, 64–77. doi: 10.1016/j.gloenvcha.2018.10.003
Dörgö, G., Sebestyén, V., and Abonyi, J. (2018). Evaluating the interconnectedness of the sustainable development goals based on the causality analysis of sustainability indicators. Sustainability 10:3766. doi: 10.3390/su10103766
Du, X., Shrestha, N. K., and Wang, J. (2019). Assessing climate change impacts on stream temperature in the athabasca river basin using swat equilibrium temperature model and its potential impacts on stream ecosystem. Sci. Tot. Environ. 650, 1872–1881. doi: 10.1016/j.scitotenv.2018.09.344
Dubey, R., Gunasekaran, A., Childe, S. J., Papadopoulos, T., Luo, Z., Wamba, S. F., et al. (2019). Can big data and predictive analytics improve social and environmental sustainability? Technol. Forecast. Soc. Change 144, 534–545. doi: 10.1016/j.techfore.2017.06.020
Erl, T., Khattak, W., and Buhler, P. (2016). Big data Fundamentals: Concepts, Drivers & Techniques. Upper Saddle River, NJ: Prentice Hall Press.
Eyring, V., Bony, S., Meehl, G. A., Senior, C. A., Stevens, B., Stouffer, R. J., et al. (2016). Overview of the coupled model intercomparison project phase 6 (CMIP6) experimental design and organization. Geosci. Model Dev. 9, 1937–1958. doi: 10.5194/gmd-9-1937-2016
Fan, C., and Mostafavi, A. (2019). Metanetwork framework for performance analysis of disaster management system-of-systems. IEEE Syst. J. 14, 1265–1276. doi: 10.1109/JSYST.2019.2926375
Fathi, S., and Srinivasan, R. (2019). “Climate change impacts on campus buildings energy use: an AI-based scenario analysis,” in Proceedings of the 1st ACM International Workshop on Urban Building Energy Sensing, Controls, Big Data Analysis, and Visualization (New York, NY), 112–119. doi: 10.1145/3363459.3363540
Fayyad, U., and Simoudis, E. (1997). “Data mining and knowledge discovery. Tutorial notes at pad’97-1st int,” in Conf. Prac. App. KDD & Data Mining (London). doi: 10.1023/A:1009715820935
Fenu, G., and Malloci, F. M. (2019). “An application of machine learning technique in forecasting crop disease,” in Proceedings of the 2019 3rd International Conference on Big Data Research (New York, NY), 76–82. doi: 10.1145/3372454.3372474
Fiore, S., Elia, D., Palazzo, C. A., D’Anca Antonio, F., Williams, D. N., et al. (2018). “Towards an open (data) science analytics-hub for reproducible multi-model climate analysis at scale,” in 2018 IEEE International Conference on Big Data (Big Data) (Seattle, WA), 3226–3234. doi: 10.1109/BigData.2018.8622205
Fischer, G., Shah, M., Tubiello, F. N., and Van Velhuizen, H. (2005). Socio-economic and climate change impacts on agriculture: an integrated assessment, 1990-2080. Philos. Trans. R. Soc. B Biol. Sci. 360, 2067–2083. doi: 10.1098/rstb.2005.1744
Fiske, S., Hubacek, K., Jorgenson, A., Li, J., McGovern, T., Rick, T., et al (2018). Drivers and Responses: Social Science Perspectives on Climate Change, Part 2. Washington, DC: USGCRP Social Science Coordinating Committee. Available online at: https://www.globalchange.gov/content/social-science-perspectives-climate-change-workshop
Fitzharris, B. (2016). Reflections on climate and water over 50 years. Austr. J. Water Resour. 20, 93–107. doi: 10.1080/13241583.2017.1348888
Flato, G., Marotzke, J., Abiodun, B., Braconnot, P., Chou, S. C., Collins, W., et al. (2014). “Evaluation of climate models, in: Climate change 2013: the physical science basis,” in Contribution of Working Group I to the Fifth Assessment Report of the Intergovernmental Panel on Climate Change (New York, NY: Cambridge University Press), 741–866.
Foley, A. M. (2018). Climate impact assessment and “Islandness”: challenges and opportunities of knowledge production and decision-making for small island developing states. Int. J. Clim. Change Strat. Manage. 10, 289–302. doi: 10.1108/IJCCSM-06-2017-0142
Ford, J. D., Tilleard, S. E., Berrang-Ford, L., Araos, M., Biesbroek, R., Lesnikowski, A. C., et al. (2016). Opinion: Big data has big potential for applications to climate change adaptation. Proc. Natl. Acad. Sci. U.S.A. 113, 10729–10732. doi: 10.1073/pnas.1614023113
Franco, C., Hepburn, L. A., Smith, D. J., Nimrod, S., and Tucker, A. (2016). A Bayesian belief network to assess rate of changes in coral reef ecosystems. Environ. Model. Softw. 80, 132–142. doi: 10.1016/j.envsoft.2016.02.029
Friedl, M. A., and Brodley, C. E. (1997). Decision tree classification of land cover from remotely sensed data. Remote Sens. Environ. 61, 399–409. doi: 10.1016/S0034-4257(97)00049-7
Füssel, H.-M., and Klein, R. J. (2006). Climate change vulnerability assessments: an evolution of conceptual thinking. Climat. Change 75, 301–329. doi: 10.1007/s10584-006-0329-3
Gandhi, N., and Armstrong, L. J. (2016). “Assessing impact of seasonal rainfall on rice crop yield of Rajasthan, India using association rule mining,” in 2016 International Conference on Advances in Computing, Communications and Informatics (ICACCI) (Jaipur), 1021–1024. doi: 10.1109/ICACCI.2016.7732178
Gao, M., Yang, Y., Shi, H., and Gao, Z. (2019). Som-based synoptic analysis of atmospheric circulation patterns and temperature anomalies in China. Atmos. Res. 220, 46–56. doi: 10.1016/j.atmosres.2019.01.005
Garcia, M. E. J. N., and Hernandez, A. A. (2017). “Pattern analysis of natural disasters in the Philippines,” in International Conference on Big Data Technologies and Applications (Cham: Springer), 74–83. doi: 10.1007/978-3-319-98752-1_9
Giest, S. (2017). Big data analytics for mitigating carbon emissions in smart cities: opportunities and challenges. Eur. Plann. Stud. 25, 941–957. doi: 10.1080/09654313.2017.1294149
Gomez-Zavaglia, A., Mejuto, J., and Simal-Gandara, J. (2020). Mitigation of emerging implications of climate change on food production systems. Food Res. Int. 2020:109256. doi: 10.1016/j.foodres.2020.109256
Gondchawar, N., and Kawitkar, R. (2016). IOT based smart agriculture. Int. J. Adv. Res. Comput. Commun. Eng. 5, 838–842. doi: 10.17148/IJARCCE.2016.56188
Gouveia, J. P., and Palma, P. (2019). Harvesting big data from residential building energy performance certificates: retrofitting and climate change mitigation insights at a regional scale. Environ. Res. Lett. 14:095007. doi: 10.1088/1748-9326/ab3781
Goyal, M. K., and Sharma, A. (2016). A fuzzy c-means approach regionalization for analysis of meteorological drought homogeneous regions in western India. Nat. Hazards 84, 1831–1847. doi: 10.1007/s11069-016-2520-9
Gulzar, M., Abbas, G., and Waqas, M. (2020). “Climate smart agriculture: a survey and taxonomy,” in 2020 International Conference on Emerging Trends in Smart Technologies (ICETST), 1–6. doi: 10.1109/ICETST49965.2020.9080695
Guo, H.-D., Zhang, L., and Zhu, L.-W. (2015). Earth observation big data for climate change research. Adv. Clim. Change Res. 6, 108–117. doi: 10.1016/j.accre.2015.09.007
Gurram, S., Sivaraman, V., Apple, J. T., and Pinjari, A. R. (2019). “Agent-based modeling to simulate road travel using big data from smartphone GPS: an application to the continental united states,” in 2019 IEEE International Conference on Big Data (Big Data) (Los Angeles, CA), 3553–3562. doi: 10.1109/BigData47090.2019.9006339
Gutierrez, B. T., Plant, N. G., and Thieler, E. R. (2011). A Bayesian network to predict coastal vulnerability to sea level rise. J. Geophys. Res. 116, 1–15. doi: 10.1029/2010JF001891
Hämäläinen, E., and Inkinen, T. (2019). Big data in emission producing manufacturing industries-an explorative literature review. ISPRS Ann. Photogr. Remote Sens. Spat. Inform. Sci. 4, 57–64. doi: 10.5194/isprs-annals-IV-4-W9-57-2019
Hamrani, A., Akbarzadeh, A., and Madramootoo, C. A. (2020). Machine learning for predicting greenhouse gas emissions from agricultural soils. Sci. Tot. Environ. 2020:140338. doi: 10.1016/j.scitotenv.2020.140338
Hassani, H., Huang, X., and Silva, E. (2019). Big data and climate change. Big Data Cogn. Comput. 3, 1–17. doi: 10.3390/bdcc3010012
Hazen, B. T., Skipper, J. B., Ezell, J. D., and Boone, C. A. (2016). Big data and predictive analytics for supply chain sustainability: a theory-driven research agenda. Comput. Industr. Eng. 101, 592–598. doi: 10.1016/j.cie.2016.06.030
He, Q., Guo, X., Li, D., Jin, Y., Zhang, L., and Zhang, R. (2020). “Research on the selection method of fy-3d/mwhts clear sky observation data based on neural network,” in Journal of Physics: Conference Series, Vol. 1656 (Qingdao: IOP Publishing), 012007. doi: 10.1088/1742-6596/1656/1/012007. Available online at: https://iopscience.iop.org/issue/1742-6596/1656/1
Hegerl, G. C., Brönnimann, S., Cowan, T., Friedman, A. R., Hawkins, E., Iles, C., et al. (2019). Causes of climate change over the historical record. Environ. Res. Lett. 14:123006. doi: 10.1088/1748-9326/ab4557
Heumann, B. W. (2011). An object-based classification of mangroves using a hybrid decision tree-support vector machine approach. Remote Sens. 3, 2440–2460. doi: 10.3390/rs3112440
Hong, J., Hong, T., Kang, H., and Lee, M. (2019). A framework for reducing dust emissions and energy consumption on construction sites. Energy Proc. 158, 5092–5096. doi: 10.1016/j.egypro.2019.01.637
Honti, G. M., and Abonyi, J. (2019). A review of semantic sensor technologies in internet of things architectures. Complexity 2019:6473160. doi: 10.1155/2019/6473160
Horcea-Milcu, A.-I., Martín-López, B., Lam, D. P., and Lang, D. J. (2020). Research pathways to foster transformation: linking sustainability science and social-ecological systems research. Ecol. Soc. 25, 1–29. doi: 10.5751/ES-11332-250113
Hou, D., Bolan, N. S., Tsang, D. C., Kirkham, M. B., and O’Connor, D. (2020). Sustainable soil use and management: an interdisciplinary and systematic approach. Sci. Tot. Environ. 2020:138961. doi: 10.1016/j.scitotenv.2020.138961
Howard, S., Howard, S., and Howard, S. (2020). Quantitative market analysis of the European climate services sector-the application of the kmatrix big data market analytical tool to provide robust market intelligence. Climate Serv. 17:100108. doi: 10.1016/j.cliser.2019.100108
Hsu, A., Höhne, N., Kuramochi, T., Roelfsema, M., Weinfurter, A., Xie, Y., et al. (2019). A research roadmap for quantifying non-state and subnational climate mitigation action. Nat. Clim. Change 9, 11–17. doi: 10.1038/s41558-018-0338-z
Hu, L. Q., Yadav, A., Khan, A., Liu, H., and Ul Haq, A. (2020). Application of big data fusion based on cloud storage in green transportation: an application of healthcare. Sci. Program. 2020:1593946. doi: 10.1155/2020/1593946
Hu, M., and Pavao-Zuckerman, M. (2019). Literature review of net zero and resilience research of the urban environment: a citation analysis using big data. Energies 12:1539. doi: 10.3390/en12081539
Hu, S., Niu, Z., and Chen, Y. (2017). Global wetland datasets: a review. Wetlands 37, 807–817. doi: 10.1007/s13157-017-0927-z
Hu, W., Li, C.-H., Ye, C., Wang, J., Wei, W.-W., and Deng, Y. (2019). Research progress on ecological models in the field of water eutrophication: Citespace analysis based on data from the ISI web of science database. Ecol. Model. 410:108779. doi: 10.1016/j.ecolmodel.2019.108779
Huang, J. (2015). Venture Capital Investment and Trend in Clean Technologies. New York, NY: Springer. doi: 10.1007/978-3-319-14409-2_11
Iacobuta, G., Dubash, N. K., Upadhyaya, P., Deribe, M., and Höhne, N. (2018). National climate change mitigation legislation, strategy and targets: a global update. Clim. Policy 18, 1114–1132. doi: 10.1080/14693062.2018.1489772
Inderwildi, O., Zhang, C., Wang, X., and Kraft, M. (2020). The impact of intelligent cyber-physical systems on the decarbonization of energy. Energy Environ. Sci. 13, 744–771. doi: 10.1039/C9EE01919G
Inukollu, V. N., Arsi, S., and Ravuri, S. R. (2014). Security issues associated with big data in cloud computing. Int. J. Netw. Secur. Appl. 6, 45–55. doi: 10.5121/ijnsa.2014.6304
Ise, T., and Oba, Y. (2020). Varenn: graphical representation of periodic data and application to climate studies. NPJ Clim. Atmos. Sci. 3, 1–6. doi: 10.1038/s41612-020-0129-x
Ishwarappa and Anuradha, J. (2015). A brief introduction on big data 5vs characteristics and hadoop technology. Proc. Comput. Sci. 48, 319–324. doi: 10.1016/j.procs.2015.04.188
Ismail, H., Kamal, M. R., bin Abdullah, A. F., and bin Mohd, M. S. F. (2020). Climate-smart agro-hydrological model for a large scale rice irrigation scheme in Malaysia. Appl. Sci. 10:3906. doi: 10.3390/app10113906
Iturriza, M., Labaka, L., Ormazabal, M., and Borges, M. (2020). Awareness-development in the context of climate change resilience. Urban Climate 32:100613. doi: 10.1016/j.uclim.2020.100613
Iwanaga, T., Wang, H.-H., Hamilton, S. H., Grimm, V., Koralewski, T. E., Salado, A., et al. (2020). Socio-technical scales in socio-environmental modeling: managing a system-of-systems modeling approach. Environ. Model. Softw. 135:104885. doi: 10.1016/j.envsoft.2020.104885
Jabbour, C. J. C., de Sousa Jabbour, A. B. L., Sarkis, J., and Godinho Filho, M. (2019). Unlocking the circular economy through new business models based on large-scale data: an integrative framework and research agenda. Technol. Forecast. Soc. Change 144, 546–552. doi: 10.1016/j.techfore.2017.09.010
Jang, H. S., Bae, K. Y., Park, H.-S., and Sung, D. K. (2016). Solar power prediction based on satellite images and support vector machine. IEEE Trans. Sustain. Energy 7, 1255–1263. doi: 10.1109/TSTE.2016.2535466
Jang, S. M., and Hart, P. S. (2015). Polarized frames on “climate change” and “global warming”? across countries and states: evidence from twitter big data. Glob. Environ. Change 32, 11–17. doi: 10.1016/j.gloenvcha.2015.02.010
Jato-Espino, D., Sillanpää, N., Andrés-Doménech, I., and Rodriguez-Hernandez, J. (2018). Flood risk assessment in urban catchments using multiple regression analysis. J. Water Resour. Plann. Manage. 144:04017085. doi: 10.1061/(ASCE)WR.1943-5452.0000874
Jimenez, S., Aviles, A., Galán, L., Flores, A., Matovelle, C., and Vintimilla, C. (2019). “Support vector regression to downscaling climate big data: an application for precipitation and temperature future projection assessment,” in Conference on Information Technologies and Communication of Ecuador (Cham: Springer), 182–193. doi: 10.1007/978-3-030-35740-5_13
Joshi, A., Pebesma, E., Henriques, R., and Appel, M. (2019). “SCIDB based framework for storage and analysis of remote sensing big data,” International Archives of the Photogrammetry, Remote Sensing and Spatial Information Sciences (Dhulikhel), 42. doi: 10.5194/isprs-archives-XLII-5-W3-43-2019
Jung, J., Maeda, M., Chang, A., Bhandari, M., Ashapure, A., and Landivar-Bowles, J. (2020). The potential of remote sensing and artificial intelligence as tools to improve the resilience of agriculture production systems. Curr. Opin. Biotechnol. 70, 15–22. doi: 10.1016/j.copbio.2020.09.003
Kadow, C., Hall, D. M., and Ulbrich, U. (2020). Artificial intelligence reconstructs missing climate information. Nat. Geosci. 13, 408–413. doi: 10.1038/s41561-020-0582-5
Kates, R. W., Clark, W. C., Corell, R., Hall, J. M., Jaeger, C. C., Lowe, I., et al. (2001). Sustainability science. Science 292, 641–642. doi: 10.1126/science.1059386
Keliang, H. (2019). “Impacts of climate change on hydrological cycle in the Yangtze River Basin Based on regression analysis,” in 2019 International Conference on Civil Engineering, Materials and Environment (ICCEME 2019) (Changchun).
Klenk, N., and Meehan, K. (2015). Climate change and transdisciplinary science: problematizing the integration imperative. Environ. Sci. Policy 54, 160–167. doi: 10.1016/j.envsci.2015.05.017
Knutti, R., Stocker, T., Joos, F., and Plattner, G.-K. (2003). Probabilistic climate change projections using neural networks. Clim. Dyn. 21, 257–272. doi: 10.1007/s00382-003-0345-1
Komorowski, M., Marshall, D. C., Salciccioli, J. D., and Crutain, Y. (2016). “Exploratory data analysis,” in Secondary Analysis of Electronic Health Records. Cham: Springer. doi: 10.1007/978-3-319-43742-2_15
Kouloukoui, D., de Oliveira Marinho, M. M., da Silva Gomes, S. M., Kiperstok, A., and Torres, E. A. (2019). Corporate climate risk management and the implementation of climate projects by the world’s largest emitters. J. Clean. Prod. 238:117935. doi: 10.1016/j.jclepro.2019.117935
Kubo, T., Uryu, S., Yamano, H., Tsuge, T., Yamakita, T., and Shirayama, Y. (2020). Mobile phone network data reveal nationwide economic value of coastal tourism under climate change. Tour. Manage. 77:104010. doi: 10.1016/j.tourman.2019.104010
Lambrinos, L. (2019). “Internet of things in agriculture: a decision support system for precision farming,” in 2019 IEEE International Conference on Dependable, Autonomic and Secure Computing, International Conference on Pervasive Intelligence and Computing, International Conference on Cloud and Big Data Computing, International Conference on Cyber Science and Technology Congress (DASC/PiCom/CBDCom/CyberSciTech) (Fukuoka), 889–892. doi: 10.1109/DASC/PiCom/CBDCom/CyberSciTech.2019.00163
Lasso, E., and Corrales, J. C. (2017). “Towards an alert system for coffee diseases and pests in a smart farming approach based on semi-supervised learning and graph similarity,” in International Conference of ICT for Adapting Agriculture to Climate Change (Cham: Springer), 111–123. doi: 10.1007/978-3-319-70187-5_9
Lavin, A., and Klabjan, D. (2015). Clustering time-series energy data from smart meters. Energy Efficien. 8, 681–689. doi: 10.1007/s12053-014-9316-0
Leitold, D., V́athy-Fogarassy, A., and Abonyi, J. (2020). Network-Based Analysis of Dynamical Systems: Methods for Controllability and Observability Analysis, and Optimal Sensor Placement. Cham: Springer Nature. doi: 10.1007/978-3-030-36472-4
Li, Z., Bagan, H., and Yamagata, Y. (2018). Analysis of spatiotemporal land cover changes in inner Mongolia using self-organizing map neural network and grid cells method. Sci. Tot. Environ. 636, 1180–1191. doi: 10.1016/j.scitotenv.2018.04.361
Li, Z., Huang, Q., Carbone, G. J., and Hu, F. (2017). A high performance query analytical framework for supporting data-intensive climate studies. Comput. Environ. Urban Syst. 62, 210–221. doi: 10.1016/j.compenvurbsys.2016.12.003
Li, Z., Yang, C., Sun, M., Li, J., Xu, C., Huang, Q., et al. (2013). “A high performance web-based system for analyzing and visualizing spatiotemporal data for climate studies,” in International Symposium on Web and Wireless Geographical Information Systems (Berlin; Heidelberg: Springer), 190–198. doi: 10.1007/978-3-642-37087-8_14
Li, Z., Zhou, W., Liu, X., Qian, Y., Wang, C., Xie, Z., et al. (2019). “Research on association rules mining of atmospheric environment monitoring data,” in National Conference on Computer Science Technology and Education (Singapore: Springer), 86–98. doi: 10.1007/978-981-15-5390-5_8
Little, J. C., Hester, E. T., Elsawah, S., Filz, G. M., Sandu, A., Carey, C. C., et al. (2019). A tiered, system-of-systems modeling framework for resolving complex socio-environmental policy issues. Environ. Model. Softw. 112, 82–94. doi: 10.1016/j.envsoft.2018.11.011
Lozano, S., Calzada-Infante, L., Adenso-Díaz, B., and García, S. (2019). Complex network analysis of keywords co-occurrence in the recent efficiency analysis literature. Scientometrics 120, 609–629. doi: 10.1007/s11192-019-03132-w
Mabrouki, J., Azrour, M., Dhiba, D., Farhaoui, Y., and El Hajjaji, S. (2021). IOT-based data logger for weather monitoring using arduino-based wireless sensor networks with remote graphical application and alerts. Big Data Min. Anal. 4, 25–32. doi: 10.26599/BDMA.2020.9020018
Maheshwari, B., Pinto, U., Akbar, S., and Fahey, P. (2020). Is urbanisation also the culprit of climate change? Evidence from Australian cities. Urban Clim. 31:100581. doi: 10.1016/j.uclim.2020.100581
Majidi, B., Hemmati, O., Baniardalan, F., Farahmand, H., Hajitabar, A., Sharafi, S., et al. (2021) “Geo-spatiotemporal intelligence for smart agricultural environmental eco-cyber-physical systems,” in Enabling AI Applications in Data Science. Studies in Computational Intelligence, Vol. 911, eds A. E. Hassanien, M. H. N. Taha, N. E. M. Khalifa (Cham: Springer). doi: 10.1007/978-3-030-52067-0_21
Mallick, R. B., Jacobs, J. M., Miller, B. J., Daniel, J. S., and Kirshen, P. (2018). Understanding the impact of climate change on pavements with cmip5, system dynamics and simulation. Int. J. Pave. Eng. 19, 697–705. doi: 10.1080/10298436.2016.1199880
Manogaran, G., and Lopez, D. (2018). Spatial cumulative sum algorithm with big data analytics for climate change detection. Comput. Electr. Eng. 65, 207–221. doi: 10.1016/j.compeleceng.2017.04.006
Marcu, I., Voicu, C., Drǎgulinescu, A. M. C., Fratu, O., Suciu, G., Balaceanu, C., et al. (2019). “Overview of IoT basic platforms for precision agriculture,” in International Conference on Future Access Enablers of Ubiquitous and Intelligent Infrastructures (Cham: Springer), 124–137. doi: 10.1007/978-3-030-23976-3_13
Maria, R. E., Junior, L. A. R., de Vasconcelos, L. E. G., Pinto, A. F. M., Tsoucamoto, P. T., Silva, H. N. A., et al. (2015). “Applying scrum in an interdisciplinary project using big data, internet of things, and credit cards,” in 2015 12th International Conference on Information Technology-New Generations (Las Vegas, NV), 67–72. doi: 10.1109/ITNG.2015.17
Mathivanan, S., and Jayagopal, P. (2019). A big data virtualization role in agriculture: a comprehensive review. Walailak J. Sci. Technol. 16, 55–70. doi: 10.48048/wjst.2019.3620
Meadows, D., Meadows, D., Randers, J., and Behrens, W. (1972). The Limits to Growth: A Report for the Club of Rome’s Project on the Predicament of Mankind. New York, NY: New American Library. doi: 10.1349/ddlp.1
Meineke, E. K., Tomasi, C., Yuan, S., and Pryer, K. M. (2020). Applying machine learning to investigate long-term insect-plant interactions preserved on digitized herbarium specimens. Appl. Plant Sci. 8:e11369. doi: 10.1002/aps3.11369
Meraner, A., Ebel, P., Zhu, X. X., and Schmitt, M. (2020). Cloud removal in sentinel-2 imagery using a deep residual neural network and SAR-optical data fusion. ISPRS J. Photogr. Remote Sens. 166, 333–346. doi: 10.1016/j.isprsjprs.2020.05.013
Milojevic-Dupont, N., and Creutzig, F. (2020). Machine learning for geographically differentiated climate change mitigation in urban areas. Sustain. Cities Soc. 2020:102526. doi: 10.1016/j.scs.2020.102526
Mourtzios, C., Kourtesis, D., Papadimitriou, N., Antzoulatos, G., Kouloglou, I. O., Vrochidis, S., et al. (2021). “Work-in-progress: smart-water, a Novel Telemetry and remote control system infrastructure for the management of water consumption in Thessaloniki,” in Internet of Things, Infrastructures and Mobile Applications. IMCL 2019. Advances in Intelligent Systems and Computing, Vol. 1192, eds M. E. Auer, and T. Tsiatsos (Cham: Springer). doi: 10.1007/978-3-030-49932-7_89
Nguyen, T. B., Wagner, F., and Schoepp, W. (2012). “EC4MACS-an integrated assessment toolbox of well-established modeling tools to explore the synergies and interactions between climate change, air quality and other policy objectives,” in International Conference on Information and Communication on Technology (Berlin; Heidelberg: Springer), 94–108. doi: 10.1007/978-3-642-32606-6_8
Nobre, G. C., and Tavares, E. (2017). Scientific literature analysis on big data and internet of things applications on circular economy: a bibliometric study. Scientometrics 111, 463–492. doi: 10.1007/s11192-017-2281-6
Olaya-Abril, A., Parras-Alcántara, L., Lozano-García, B., and Obregón-Romero, R. (2017). Soil organic carbon distribution in mediterranean areas under a climate change scenario via multiple linear regression analysis. Sci. Tot. Environ. 592, 134–143. doi: 10.1016/j.scitotenv.2017.03.021
Pachepsky, Y., Rajkai, K., and Tóth, B. (2015). Pedotransfer in soil physics: trends and outlook–a review. Agrokémia és Talajtan 64, 339–360. doi: 10.1556/0088.2015.64.2.3
Park, S.-T., Kim, D.-Y., and Li, G. (2020). An analysis of environmental big data through the establishment of emotional classification system model based on machine learning: focus on multimedia contents for portal applications. Multimed. Tools Appl. 1–19. doi: 10.1007/s11042-020-08818-5
Pauliuk, S. (2020). Making sustainability science a cumulative effort. Nat. Sustainabil. 3, 2–4. doi: 10.1038/s41893-019-0443-7
Peterson, A. T., Ortega-Huerta, M. A., Bartley, J., Sánchez-Cordero, V., Soberón, J., Buddemeier, R., et al. (2002). Future projections for Mexican faunas under global climate change scenarios. Nature 416, 626–629. doi: 10.1038/416626a
Pileggi, S. F., and Lamia, S. A. (2020). Climate change timeline: an ontology to tell the story so far. IEEE Access 8, 65294–65312. doi: 10.1109/ACCESS.2020.2985112
Poff, N. L., Tokar, S., and Johnson, P. (1996). Stream hydrological and ecological responses to climate change assessed with an artificial neural network. Limnol. Oceanogr. 41, 857–863. doi: 10.4319/lo.1996.41.5.0857
Qin, Y., and Chi, M. (2020). Rsimagenet: a universal deep semantic segmentation lifecycle for remote sensing images. IEEE Access 8, 68254–68267. doi: 10.1109/ACCESS.2020.2986514
Radhika, T., Gouda, K. C., and Kumar, S. S. (2016). “Big data research in climate science,” in 2016 International Conference on Communication and Electronics Systems (ICCES) (Coimbatore), 1–6. doi: 10.1109/CESYS.2016.7889855
Rahmati, O., Darabi, H., Haghighi, A. T., Stefanidis, S., Kornejady, A., Nalivan, O. A., et al. (2019). Urban flood hazard modeling using self-organizing map neural network. Water 11:2370. doi: 10.3390/w11112370
Rao, N. (2018). Big data and climate smart agriculture-status and implications for agricultural research and innovation in India. Proc. Indian Natl. Sci. Acad. 84, 625–640. doi: 10.16943/ptinsa/2018/49342
Rashid, R. A., Nohuddin, P. N., and Zainol, Z. (2017). “Association rule mining using time series data for Malaysia climate variability prediction,” in International Visual Informatics Conference (Cham: Springer), 120–130. doi: 10.1007/978-3-319-70010-6_12
Raut, R. D., Mangla, S. K., Narwane, V. S., Gardas, B. B., Priyadarshinee, P., and Narkhede, B. E. (2019). Linking big data analytics and operational sustainability practices for sustainable business management. J. Clean. Prod. 224, 10–24. doi: 10.1016/j.jclepro.2019.03.181
Rees, E., Ng, V., Gachon, P., Mawudeku, A., McKenney, D., Pedlar, J., et al. (2019). Risk assessment strategies for early detection and prediction of infectious disease outbreaks associated with climate change. Can. Commun. Dis. Rep. 45, 119–126. doi: 10.14745/ccdr.v45i05a02
Rockström, J., Steffen, W., Noone, K., Persson, A., Chapin, F. S. III., Lambin, E., et al. (2009). Planetary boundaries: exploring the safe operating space for humanity. Ecol. Soc. 14, 1–33. doi: 10.5751/ES-03180-140232
Rogelj, J., Den Elzen, M., Höhne, N., Fransen, T., Fekete, H., Winkler, H., et al. (2016). Paris agreement climate proposals need a boost to keep warming well below 2 c, Nature 534, 631–639. doi: 10.1038/nature18307
Rolnick, D., Donti, P. L., Kaack, L. H., Kochanski, K., Lacoste, A., Sankaran, K., et al. (2019). Tackling climate change with machine learning. arXiv [Preprint]. arXiv:1906.05433.
Ross, S. A., and Cheah, L. (2019). Uncertainty quantification in life cycle assessments: exploring distribution choice and greater data granularity to characterize product use. J. Indus. Ecol. 23, 335–346. doi: 10.1111/jiec.12742
Sarker, M. N. I., Yang, B., Lv, Y., Huq, M. E., and Kamruzzaman, M. (2020). Climate change adaptation and resilience through big data. Sci. Inform. Organ. 11, 533–539. doi: 10.14569/IJACSA.2020.0110368
Sasaki, S., Kiyoki, Y., Sarkar-Swaisgood, M., Wijitdechakul, J., Rachmawan, I. E. W., Srivastava, S., et al. (2020). 5d world map system for disaster-resilience monitoring from global to local: environmental AI system for leading SDG 9 and 11. Inform. Model. Knowl. Bases 321:306.
Schnase, J. L., Lee, T. J., Mattmann, C. A., Lynnes, C. S., Cinquini, L., Ramirez, P. M., et al. (2016). Big data challenges in climate science: improving the next-generation cyberinfrastructure. IEEE Geosci. Remote Sens. Mag. 4, 10–22. doi: 10.1109/MGRS.2015.2514192
Scholze, M., Knorr, W., Arnell, N. W., and Prentice, I. C. (2006). A climate-change risk analysis for world ecosystems. Proc. Natl. Acad. Sci. U.S.A. 103, 13116–13120. doi: 10.1073/pnas.0601816103
Sebestyén, V., Bulla, M., Rédey, Á., and Abonyi, J. (2019). Network model-based analysis of the goals, targets and indicators of sustainable development for strategic environmental assessment. J. Environ. Manage. 238, 126–135. doi: 10.1016/j.jenvman.2019.02.096
Seles, B. M. R. P., de Sousa Jabbour, A. B. L., Jabbour, C. J. C., de Camargo Fiorini, P., Mohd-Yusoff, Y., and Thomé, A. M. T. (2018). Business opportunities and challenges as the two sides of the climate change: corporate responses and potential implications for big data management towards a low carbon society. J. Clean. Prod. 189, 763–774. doi: 10.1016/j.jclepro.2018.04.113
Semlali, B.-E. B., and El Amrani, C. (2021). Big data and remote sensing: a new software of ingestion. Int. J. Electr. Comput. Eng. 11, 1521–1530. doi: 10.11591/ijece.v11i2.pp1521-1530
Semlali, B.-E. B., El Amrani, C., and Ortiz, G. (2020). Sat-ETL-integrator: an extract-transform-load software for satellite big data ingestion. J. Appl. Remote Sens. 14:018501. doi: 10.1117/1.JRS.14.018501
Senay, G. B., Schauer, M., Friedrichs, M., Velpuri, N. M., and Singh, R. K. (2017). Satellite-based water use dynamics using historical landsat data (1984-2014) in the southwestern United States. Remote Sens. Environ. 202, 98–112. doi: 10.1016/j.rse.2017.05.005
Seyedzadeh, S., Rahimian, F. P., Glesk, I., and Roper, M. (2018). Machine learning for estimation of building energy consumption and performance: a review. Visual. Eng. 6:5. doi: 10.1186/s40327-018-0064-7
Sharif, M., and Burn, D. H. (2006). Simulating climate change scenarios using an improved k-nearest neighbor model. J. Hydrol. 325, 179–196. doi: 10.1016/j.jhydrol.2005.10.015
Sharifi, A. (2019). A critical review of selected smart city assessment tools and indicator sets. J. Clean. Prod. 233, 1269–1283. doi: 10.1016/j.jclepro.2019.06.172
Shirkhorshidi, A. S., Aghabozorgi, S., Wah, T. Y., and Herawan, T. (2014). “Big data clustering: a review,” in International Conference on Computational Science and Its Applications (Cham: Springer), 707–720. doi: 10.1007/978-3-319-09156-3_49
Song, M., Cen, L., Zheng, Z., Fisher, R., Liang, X., Wang, Y., et al. (2017). How would big data support societal development and environmental sustainability? Insights and practices. J. Clean. Product. 142, 489–500. doi: 10.1016/j.jclepro.2016.10.091
Steffen, W., Richardson, K., Rockström, J., Cornell, S. E., Fetzer, I., Bennett, E. M., et al. (2015). Planetary boundaries: guiding human development on a changing planet. Science 347:6223. doi: 10.1126/science.1259855
Sullivan, C. A., and Huntingford, C. (2009). “Water resources, climate change and human vulnerability,” in 18th World IMACS/MODSIM Congress (Cairns), 1–8.
Tang, J., Körner, C., Muraoka, H., Piao, S., Shen, M., Thackeray, S. J., et al. (2016). Emerging opportunities and challenges in phenology: a review. Ecosphere 7, 1–17. doi: 10.1002/ecs2.1436
Tannahill, B. K., and Jamshidi, M. (2014). System of systems and big data analytics-bridging the gap. Comput. Electr. Eng. 40, 2–15. doi: 10.1016/j.compeleceng.2013.11.016
Taranto, F., Nicolia, A., Pavan, S., De Vita, P., and D’Agostino, N. (2018). Biotechnological and digital revolution for climate-smart plant breeding. Agronomy 8, 2–20. doi: 10.3390/agronomy8120277
Taylor, K. E., Stouffer, R. J., and Meehl, G. A. (2012). An overview of cmip5 and the experiment design. Bull. Am. Meteorol. Soc. 93, 485–498. doi: 10.1175/BAMS-D-11-00094.1
Teng, S., Khong, K. W., and Ha, N. C. (2020). Palm oil and its environmental impacts: a big data analytics study. J. Clean. Prod. 274:122901. doi: 10.1016/j.jclepro.2020.122901
Teng, S.-Y., Ou, C.-K., and Chuang, K.-T. (2019). On the discovery of spatial-temporal fluctuating patterns. Int. J. Data Sci. Analyt. 8, 57–75. doi: 10.1007/s41060-018-0159-1
Toujani, A., Achour, H., Turki, S. Y., and Faíz, S. (2020). Estimating forest losses using spatio-temporal pattern-based sequence classification approach. Appl. Artif. Intell. 1–25. doi: 10.1080/08839514.2020.1790247
Tripathi, S., Srinivas, V., and Nanjundiah, R. S. (2006). Downscaling of precipitation for climate change scenarios: a support vector machine approach. J. Hydrol. 330, 621–640. doi: 10.1016/j.jhydrol.2006.04.030
Uddin, M. N., Islam, A. S., Bala, S. K., Islam, G. T., Adhikary, S., Saha, D., et al. (2019). Mapping of climate vulnerability of the coastal region of Bangladesh using principal component analysis. Appl. Geogr. 102, 47–57. doi: 10.1016/j.apgeog.2018.12.011
UN (2016). A/RES/70/1Transforming our world: The 2030 agenda for sustainable development. United Nations.
Van der Linden, S. (2015). The social-psychological determinants of climate change risk perceptions: towards a comprehensive model. J. Environ. Psychol. 41, 112–124. doi: 10.1016/j.jenvp.2014.11.012
Venkatasubramanian, V., Rengaswamy, R., and Kavuri, S. N. (2003). A review of process fault detection and diagnosis: Part II: qualitative models and search strategies. Comput. Chem. Eng. 27, 313–326. doi: 10.1016/S0098-1354(02)00161-8
Wang, G., Mang, S., Cai, H., Liu, S., Zhang, Z., Wang, L., et al. (2016). Integrated watershed management: evolution, development and emerging trends. J. For. Res. 27, 967–994. doi: 10.1007/s11676-016-0293-3
Wang, M., Ullrich, P., and Millstein, D. (2020). Future projections of wind patterns in California with the variable-resolution CESM: a clustering analysis approach. Climate Dyn. 54, 2511–2531. doi: 10.1007/s00382-020-05125-5
Wang, Q., Huang, J., Liu, R., Men, C., Guo, L., Miao, Y., et al. (2020). Sequence-based statistical downscaling and its application to hydrologic simulations based on machine learning and big data. J. Hydrol. 2020:124875. doi: 10.1016/j.jhydrol.2020.124875
Wang, Z., Xue, M., Wang, Y., Song, M., Li, S., Daziano, R. A., et al. (2019). Big data: new tend to sustainable consumption research. J. Clean. Prod. 236:117499. doi: 10.1016/j.jclepro.2019.06.330
Wright, C., and Nyberg, D. (2017). An inconvenient truth: how organizations translate climate change into business as usual. Acad. Manage. J. 60, 1633–1661. doi: 10.5465/amj.2015.0718
Wu, W., Simpson, A. R., and Maier, H. R. (2010). Accounting for greenhouse gas emissions in multiobjective genetic algorithm optimization of water distribution systems. J. Water Resour. Plann. Manage. 136, 146–155. doi: 10.1061/(ASCE)WR.1943-5452.0000020
Xie, B., Brewer, M. B., Hayes, B. K., McDonald, R. I., and Newell, B. R. (2019). Predicting climate change risk perception and willingness to act. J. Environ. Psychol. 65:101331. doi: 10.1016/j.jenvp.2019.101331
Xie, H., Zhang, Y., Choi, Y., and Li, F. (2020). A scientometrics review on land ecosystem service research. Sustainability 12:2959. doi: 10.3390/su12072959
Xie, Y., Kou, X., and Li, P. (2019). A simulation method of three-dimensional cloud over WRF big data, EURASIP J. Wireless Commun. Network. 2019, 1–10. doi: 10.1186/s13638-019-1584-0
Yan, Y., Xu, X., Liu, X., Wen, Y., and Ou, J. (2020). Assessing the contributions of climate change and human activities to cropland productivity by means of remote sensing. Int. J. Remote Sens. 41, 2004–2021. doi: 10.1080/01431161.2019.1681603
Yan-e, D. (2011). “Design of intelligent agriculture management information system based on IOT,” in 2011 Fourth International Conference on Intelligent Computation Technology and Automation, Vol. 1 (Shenzhen), 1045–1049. doi: 10.1109/ICICTA.2011.262
Yang, C., Su, G., and Chen, J. (2017). “Using big data to enhance crisis response and disaster resilience for a smart city,” in 2017 IEEE 2nd International Conference on Big Data Analysis (ICBDA) (Beijing), 504–507. doi: 10.1109/ICBDA.2017.8078684
Yang, J., Gong, P., Fu, R., Zhang, M., Chen, J., Liang, S., et al. (2013). The role of satellite remote sensing in climate change studies. Nat. Clim. Change 3, 875–883. doi: 10.1038/nclimate1908
Yuan, M., and Bothwell, J. (2013). “Space-time analytics for spatial dynamics,” in Data Mining: Concepts, Methodologies, Tools, and Applications, ed I. Management Association (Hershey, PA: IGI Global), 2117–2131. doi: 10.4018/978-1-4666-2455-9.ch108
Yusof, N., and Zurita-Milla, R. (2017). Mapping frequent spatio-temporal wind profile patterns using multi-dimensional sequential pattern mining. Int. J. Digit. Earth 10, 238–256. doi: 10.1080/17538947.2016.1217943
Zaki, M. J., and Ho, C.-T. (2000). Large-Scale Parallel Data Mining, No. 1759. Springer Science & Business Media. doi: 10.1007/3-540-46502-2
Zare, M., and Koch, M. (2018). Groundwater level fluctuations simulation and prediction by anfis-and hybrid wavelet-anfis/fuzzy c-means (Fcm) clustering models: application to the miandarband plain. J. Hydro Environ. Res. 18, 63–76. doi: 10.1016/j.jher.2017.11.004
Zhang, H., Xu, Y., and Kanyerere, T. (2020). A review of the managed aquifer recharge: historical development, current situation and perspectives. Phys. Chem. Earth Parts A/B/C 2020:102887. doi: 10.1016/j.pce.2020.102887
Zhao, J., Yao, L., Huang, Z. C., Zhang, L. C., Liu, Y., and Li, G. Q. (2019). “International reanalysis cooperation on carbon satellites data,” in Proc. SPIE 11152, Remote Sensing of Clouds and the Atmosphere XXIV (Strasbourg), 111520L. doi: 10.1117/12.2538614
Zheng, F., Tao, R., Maier, H. R., See, L., Savic, D., Zhang, T., et al. (2018). Crowdsourcing methods for data collection in geophysics: state of the art, issues, and future directions. Rev. Geophys. 56, 698–740. doi: 10.1029/2018RG000616