Enhancing students’ attitudes towards statistics through innovative technology-enhanced, collaborative, and data-driven project-based learning
Attitudes have been broadly defined as not directly observable, inferred aspects consisting of beliefs, feelings, and behavioural predispositions towards the object to which they are directed (Nolan et al., 2012). Although the attitude definition is not consistent in the literature, in accordance with the most frequent definitions in research, an attitude is a psychological tendency that is expressed by evaluating a particular entity with some degree of favour or disfavour (Savelsbergh et al., 2016). Hence, this psychological tendency is shaped through experience and determines future behaviours. In this line of argument, an attitude can be seen as a personal characteristic that has an influence on subject’s behaviour (Di Martino and Zan, 2015).
In the context of learning, attitudes towards mathematics, and statistics in particular, are profound feelings and emotional reactions shaped by students’ experience in solving statistics tasks and throughout time (Tuohilampi, 2016). In other words, attitudes toward statistics can be seen as students’ expectations towards this subject, and according to them, the student will have one reaction or another in statistics class (Batanero and Díaz, 2011). Math anxiety is the sensation of concern and worry felt when thinking about mathematics or while doing a mathematics task (Abín et al., 2020).
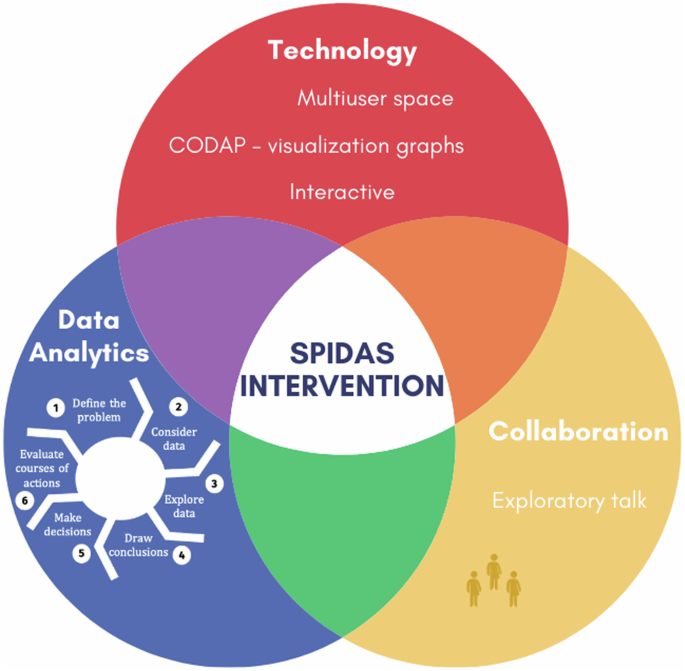
Educational research claims that positive attitudes towards mathematics and statistics can be promoted by implementing innovative teaching methods that include, among others, the following five educational variables: (a) student-centred learning; (b) project-based learning and solving real problems or challenges familiar to students; (c) data analytics (henceforth DA) skills; (d) collaborative learning and e) use of interactive technologies (Chew and Dillon, 2014; Savelsbergh et al., 2016).
In this line of argument, recently, the growth in the everyday use of digital technologies is creating vast reservoirs of data. These data have huge but largely untapped potential. The economic sector has already considered the necessity to understand the “big data” generated in each sector and turn it into insight and action. Therefore, there is an increasing demand for citizens with the skills and creativity capable to perform data-driven decision making (Frischemeier et al., 2022). For example, the Guidelines for Assessment and Instruction in Statistics Education (GAISE) Report (Bargagliotti et al., 2020) for the pre-K-12 classroom explicitly emphasize the need for innovative instructional programmes about data analytics to teach students to: formulate questions that can be answered using data, learn to collect data, organize data, create graphs and charts with data to answer their questions. In this context, there is a need for studies that innovate and extend best practices in teaching statistics in schools using data analysis and technology-enhancement through a project-based learning approach (Chew and Dillon, 2014; Koparan and Güven, 2014). Countless investigations point to the positive impact of technology on students’ attitudes, and so technology-driven teaching becomes a useful pedagogical tool for teaching and learning statistics (Emmioğlu and Capa-Aydin, 2012; Ramirez et al., 2012).
In this line of research, this paper aims to design, implement, and evaluate a technology-enhanced, project-based intervention that could offer secondary students the statistical and digital skills needed to use data to address real-life problems. Specifically, in this paper, we analyse the effects that this technology-enhanced project-based intervention could have on students’ attitudes toward statistics. Our working hypothesis is that students will improve their positive attitudes towards statistics because the technology-enhanced project-based intervention will create a meaningful and positive learning environment that will raise the student’s awareness of the role of data, statistics, and technology in many everyday problems.
In the next sections, we revise previous research on the effects of the four uncombined, innovative educational variables in statistics education, namely: (i) project-based learning, (ii) data analytics approach, (iii) use of technology, and (iv) collaborative work. This will be followed by our research study, the results and discussion of our findings and, finally, the educational implications for statistics education.
Project-based learning and data analytics approach
The use of project-based Learning (henceforth PBL) has been increasingly practised globally in schools. This methodology is characterized by the introduction of the following four educational variables: student-centred learning, problem-solving structured in different research phases, contextualized learning contents in real and open-ended challenges and collaborative work (Haatainen and Aksela, 2021). In this line, Batanero and Díaz (2011) claim the importance of contextualizing the data used in real-life problems when designing PBL in statistics. This aspect encourages, firstly, the student’s interest and motivation, even more so if they can choose to tackle the problems they are interested in; secondly, students value the relevance of statistics since it can solve real-life problems and facilitate scientific and economic development. Overall, they adhere to the theory that PBL can improve the students’ attitudes toward statistics. In this same line of argument, Santos (2016) adds to the equation the influential role of digital technologies in solving collaboratively real-life problems and increasing the positive attitudes towards learning statistics to solve a problem in small groups.
Different quasi-experimental studies have reported the benefits of this innovative methodology on students learning and on students’ attitudes and affect towards statistics (Bateiha et al., 2020; Chong et al., 2019; Özdemir et al., 2015; Markulin et al., 2021). In these studies, it is reported that PBL methodology promotes the creation of a creative environment, as most students perceived the project to be an easy and enjoyable activity that favours the learning of mathematical concepts as well as the development of key soft skills such as sense of responsibility, communication skills and ability to work in small groups (Özdemir et al., 2015). Besides, PBL encourages students to take a more active role by allowing them to take responsibility for and decisions on their own learning process while the teacher guides them through their learning processes, by taking into account their interests (Moreno-Guerrero et al., 2020). These PBL characteristics could have a positive impact on students’ attitudes towards statistics (Özdemir et al., 2015), and on students’ affect towards learning statistics (Chong et al., 2019).
Recently, along with the appearance of interactive technologies, new ways of engaging with real-life data—notably via interactive data visualizations—have emerged and new ways of thinking and learning from complex data have evolved (Engel, 2017; Sutherland and Ridgway, 2017, Rao et al., 2023). In this context, various authors have seen the need to develop studies that introduce the perspective of data analytics when designing PBL in teaching statistics (Kazak et al., 2021; Zotou et al., 2020). From this perspective, data analytics is seen as a process of engaging students creatively in exploring data to understand our world better, draw conclusions, make decisions and predictions, and critically evaluate present/future courses of action (Fujita et al., 2018). Data analytics does not focus on learning mathematical procedures but on understanding and interpreting data to solve a real-life problem (Chew and Dillon, 2014). Furthermore, data analytics reinforces the active role of students in learning statistics as they must make the effort to focus on the process of understanding and interpreting data to address a real-life problem. The students are encouraged to solve the problem since the teacher acts only as a guide and will not provide them with a solution.
Interactive technologies have been essential in teaching and learning statistics and data analytics. Technologies can provide a creative and interactive environment to represent, visualize and manipulate data in a way that encourages students to think and learn from complex data. In this respect, our educative intervention has designed a technology-enhanced, project-based learning environment that promotes the use of a variety of technological tools for learning key statistical concepts and developing key skills, e.g., explore, understand and interpret data to solve a real problem. In the next section, we will present key studies that have used technology affordances to promote better statistical literacy and positive attitudes toward statistics.
Use of technology to increase the students’ attitudes toward statistics
In the use of technology for teaching mathematics, there is a trend towards constructivist tasks based on research, which supports collaborative approaches, resolution of problems, and the practice of learning by doing. Bray and Tangney (2017) point this out through a systematic analysis of 139 studies and, in view of the results, conclude that contemporary technologies increase collaboration and allow a practical application of mathematics through visualization, modelling and manipulation. They claim that technologies provide an interactive, dynamic, and contextualized learning of the subject. These technological affordances facilitate experimentation and testing of ideas and manage to change classroom dynamics from the teacher leading the session and transmitting knowledge to more dynamic student-centred research.
Technological tools are also increasingly used in teaching statistics as the means to mediate and promote learning of problem-solving strategies and statistical challenges. Among the affordances of technologies to promote statistical education, Ridgway et al. (2017) highlight data visualizations as they facilitate interaction with data in a more intuitive, dynamic, and exploratory way. Such software programmes as TinkerPlots (dynamic data exploration, available at https://www.tinkerplots.com/) or common online data analysis platform (CODAP, available on http://codap.concord.org) are widely used to promote statistical literacy and positive attitudes toward statistics. Among the main characteristics of these software programmes, the more salient are the next four: (a) they facilitate modelling activities, in which students can deeply analyse real-world situations through mathematical representations and asking questions, (b) they mediate between conceptual thinking and investigate probability events and identify patterns, (c) they improve intuition about data representation and analysis, and (d) they facilitate the creation of graphs (Gonzalez and Trelles, 2019; Kazak et al., 2014).
Various authors provide evidence of how the characteristics of technologies such as TinkerPlots, CODAP, and Fathom improve the students’ learning and attitudes. Gonzalez and Trelles (2019) investigated how a group of 15-year-old students increased their motivation through modelling activities in mathematics through TinkerPlots. In this study, modelling is defined as a learning system that encourages students to ask questions and analyse situations that could be real through mathematics. Other authors agree that the use of technological tools, such as CODAP is essential to develop students’ statistical reasoning (Casey et al., 2020; Mojica et al., 2019). The ability of CODAP to facilitate working with large data sets makes it easier for students to focus on making decisions about data analysis and reasoning about different forms of data representation, rather than on struggling with computational work, since no programming knowledge is required (Casey et al., 2020; Frischemeier et al., 2021). In this line, Kazak et al. (2014) showed how 11-year-olds improved their understanding of statistics with the help of TinkerPlots through collaborative work in small groups. The authors used TinkerPlots as a technology that mediated conceptual thinking to investigate various probability events in statistics and identify patterns. They argued that this software favoured the improvement of the students’ intuition about data representation and analysis and facilitated the creation of graphs.
Many other studies amplify the potential of technology in favouring positive attitudes and learning of mathematics by integrating technology in the classroom along with other teaching and learning strategies that have also proved relevant for improving mathematics learning. Attard and Holmes (2020) show that new technologies manage to place the student at the centre of the teaching–learning process: technology captures the attention and interest of students by means of immediate instructions and feedback. In addition, technology offers students an additional and different space for communication, beyond the classroom (Attard and Holmes, 2020).
The technology-enhanced, project-based study presented in this paper explicitly implements the findings of recent educational research based on supporting classroom dialogue, thinking and collaborative learning. In the next section, we will present these key findings.
Collaborative work
Collaborative work has been embedded in PBL (Fredriksen, 2021; Lyons et al., 2021; Ozdamli et al., 2013; Özdemir et al., 2015) and its impact on students’ development of positive attitudes towards mathematical learning is highly reported (Kazak et al., 2014; Moreno-Guerrero et al., 2020; Özdemir et al., 2015). Furthermore, educational research claims that interactive technologies can afford group work and communication and enrich the development of key problem-solving strategies (Kazak et al., 2014; Major et al., 2018; Noll et al., 2018).
Promotion of collaborative learning involves working explicitly on ground rules, interactional processes, and exploratory talk (Mercer, 2019). Exploratory talk improves attitudes toward learning as it facilitates the exploration and understanding of content and promotes intersubjectivity between group members when creating jointly new knowledge and understandings (Gómez, 2016; Knight and Mercer, 2015; Mercer et al., 2019). Dialogue is also very important for better organization and management of the group. This aspect is verified by Kazak et al. (2014) through an intervention based on collaborative work with technology. In this experiment, students were instructed to communicate with their classmates in a dialogical way, following five ground rules: (1) ensuring that all members of the group contribute with ideas; (2) asking classmates for arguments, listening to explanations and making an effort to understand; (3) being interested in what the others think; (4) taking into account different points of view or alternative methods, and (5) trying to reach a consensus before carrying out an action with the computer. This study, whose main objective was to teach key concepts of statistics and probability to 11-year-old students, through qualitative analysis of the dialogues from the groups, concluded that the students improved their communication with and opinions about their classmates. It also proved that their contributions were incorporated and integrated, thus facilitating the consensus of ideas.
The study
Our study aims to contribute to research on the design and application of innovative methods in teaching statistics. To this end, our research took a quasi-experimental approach toward answering the following research question: what are the effects of a collaborative, technology-enhanced and data-driven project-based intervention on students’ attitudes towards statistics? Our general working hypothesis was that the design and implementation of a long-term real-classroom intervention that embeds and combines the three key educative variables for the promotion of statistics education, i.e., collaborative learning, technology-enhanced learning, and project-based learning, would have a positive impact on the students’ attitudes towards statistics. Furthermore, our expectations were that those students who received a collaborative, technology-enhanced project-based intervention would improve their attitudes towards statistics unlike their counterparts who followed a regular standard curriculum.
Our research aims to confirm or reject the next four hypotheses:
H1. Students following the collaborative, technology-enhanced, data-driven project-based intervention (henceforth SPIDAS) will improve their global attitude towards statistics. This increment will be higher than their counterparts who follow a traditional intervention.
H2. Students following the SPIDAS intervention will decrease their anxiety towards statistics, unlike their counterparts who follow a traditional intervention.
H3. Students following the SPIDAS intervention will increase their affect towards statistics more than their counterparts who follow a traditional intervention.
H4. Students following the SPIDAS intervention will improve their attitude towards learning statistics with technology more than their counterparts who follow a traditional intervention.