Changes in semantic memory structure support successful problem-solving and analogical transfer
The three studies were not preregistered. Gender was determined based on information provided by participants. We did not collect information about ethnicity. Data distribution was assumed to be normal, but this was not formally tested (Figs. S1, S2, and S3).
Participants
In Study 1, ninety-nine native French speakers aged between 18 and 38 years old (mean age = 26 years, standard error of the mean, SEM = 2.60 years; 69 women and 30 men) were included. All participants were healthy adults with no history of neurological and/or psychiatric illness and no psychoactive substance abuse. This sample was a sample of convenience. An approved ethics committee approved the study (CPP Ile-de-France III, 2019-A00562-55). All the participants gave their written informed consent and received 10€/hour as monetary compensation. After preprocessing, we excluded 19 participants’ data resulting in a final sample of 80 participants used in statistical analyses. Details about exclusions are available in each relevant section.
Experimental procedure
Participants underwent a 4h-experiment during which they had to solve four riddles (labeled “Zoe”, “Daniel”, “Car”, and “Bar” riddles) and underwent a relatedness judgment task (RJT) in order to build individual-based SemNets. The four riddles were made of two pairs of analogous riddles, i.e., the problem and its solution of one riddle of the pair shared a common global schema with the second one (Zoe/Car riddles and Bar/Daniel riddles).
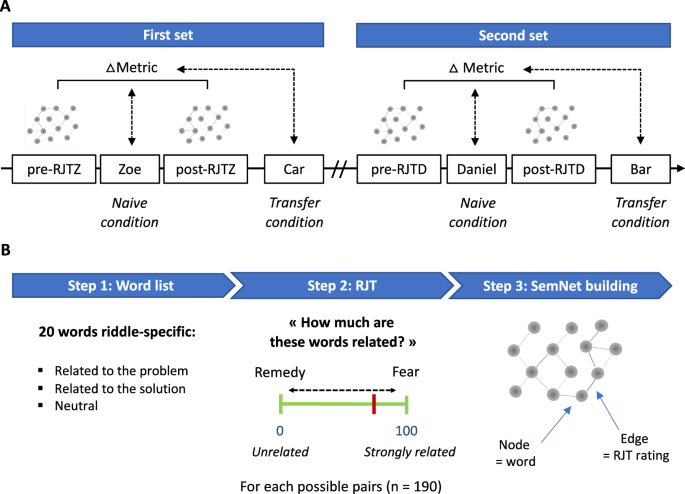
Participants were asked to solve the two pairs of riddles, one at a time, according to the following procedure (Fig. 1A). They first attempted to solve one riddle of the pair (e.g., Zoe riddle) for 10-min. Before and after this solving phase, participants performed the RJT. Then, the solution to the riddle was provided to the participants, followed by an independent task. Finally, they attempt to solve the second riddle of the pair (i.e., Car riddle) for 4-min. After a 15-min break followed by various creativity tasks, participants were presented with the other pair of riddles (i.e., Bar and Daniel riddles) following the same procedure. The order of riddles within each pair was counterbalanced among participants. The order in which the riddles were presented to the participants defined the naive condition (i.e., first presented riddle, without an analogous one before) or the transfer condition (i.e., second presented riddle, preceded by an analogous one). In addition, the order of the pairs of riddles within the experimental design was counterbalanced among participants to ensure that neither positive (training) nor negative (fatigue) effects related to which riddle came first interfered with the results (four possible combinations: Zoe/Car then Daniel/Bar, n = 25; Daniel/Bar then Zoe/Car, n = 24; Bar/Daniel then Car/Zoe, n = 25; and Car/Zoe then Bar/Daniel, n = 25).

A Experimental design. Each participant had to sequentially solve two pairs of riddles (e.g., first set Zoe/Car then second set Daniel/Bar) separated by a 15-min break followed by various creativity tasks (not shown in the figure). Within each pair of riddles, the naive condition corresponded to the first presented riddle and the transfer condition to the second one. Each riddle-specific Relatedness Judgment Task (RJT) was performed before and after the solving phase related to the riddles in the naive condition. Pre- and post-RJT were similar for a given riddle (RJTZ referred to RJT specific to Zoe riddle, and RJTD to RJT specific to Daniel riddle). They were used to build individual semantic networks (SemNets) and assess changes in their organization during the solving phase (ΔMetric). The ΔMetric was used to predict the successful problem-solving of a problem and an analogous one. B SemNets construction based on RJT. First (step 1), 20 words were specifically selected for each riddle and thus differed between riddles’ RJTs. Then (step 2), participants had to rate the strength of relatedness (RJT) between two words on a visual scale from 0 (unrelated) to 100 (strongly related). For instance, they had to assess the degree to which the word ‘remedy’ is related to the word ‘fear’. Word pairs composing riddle-specific RJT trials were all possible combinations of these 20 words (n = 190 pairs). Finally (step 3), individual SemNets were built using the word list and the RJT ratings. SemNets metrics were then computed for each individual, both in the pre and post conditions, for each riddle.
All tasks were computed using the Psychopy software62 running on individual computers in a classroom dedicated to cognitive experiments (https://prisme.institutducerveau-icm.org). Task-related instructions were initially explained and repeated before the beginning of each task.
Problem-solving
To test whether problem-solving was related to a restructuring of semantic associations, we needed to construct problems that: (i) were verbal (to allow building SemNets from the RJT ratings with words that made sense to the problem); (ii) had a unique solution (to facilitate the classification of participants as solvers or non-solvers); (iii) were difficult enough (to be able to measure a change after a solving phase); (iv) were likely to necessitate creative thinking (to maximize our chances to observe a restructuring of semantic associations) and (v) could be used to build analogous problems. Problems requiring creative thinking are often ill-defined (i.e., no specific heuristics or usual rules could be used to solve the problem) and putatively prompt a usual representation that one needs to overcome in order to solve the problem. Riddles like the one found in ref. 12. satisfy all of those criteria. We thus selected the Durso riddle and translated it into French (the “Bar” riddle). As we could not find any other similar riddles in the scientific literature, we picked one relevant riddle displayed on different riddle websites and rated as tricky in a pilot study (the “Car” riddle). Finally, we created two novel riddles in such a way that the problem situation/solution was analogous to the “Bar” riddle (the “Daniel” riddle; in both riddles, a person with a threatening behavior is actually helpful) and to the “Car’ riddle (the “Zoe” riddle; in both riddles, a person apparently involved in a real-life situation is actually playing a game). We ensured that initial and analogous riddles were in distinct semantic domains or contexts. The riddles in French and with their English translation are available in Tables S1 and S2. For example, the Zoe riddle states the following: “Zoe throws a stone that lands in the sky. How is it possible and in which context?” and the Bar riddle is the one used by ref. 12 (described in the introduction).
After each riddle presentation, participants had up to 10 min in the naive condition and 4 min in the transfer condition to search for the solution. During this time, the riddle remained displayed at the center of the screen. Participants were instructed to report all ideas that came to mind, even if they judged them bizarre or irrelevant. They could press the space button anytime to propose a response but had to do it only if they knew what to write (to avoid getting additional thinking time). Pressing the space bar stopped the timer. Participants then had up to 30 s to write their ideas using the keyboard. The number of ideas a participant could propose was not limited, and no feedback on the response correctness was provided. For each response they gave, participants were first asked to indicate the confidence they had in their response on a visual scale from 0 (“not sure at all”) to 100 (“completely sure”). Afterwards, a new screen displayed “Eureka?”, and the participants indicated whether their response came to their mind with an insight or Eureka phenomenon by pressing a “yes” or “no” button63. Participants were told that a Eureka is “the subjective experience you may have when you solve a problem, and the solution comes to mind suddenly, is not the direct result of cognitive effort, and you are not able to report the mental steps leading to this solution”. It was opposed to analytic solving where “you have a strategy and the feeling of gradually getting closer to the solution”. We also told participants that these two solving methods were not exclusive and instructed them to consider only the few seconds before the idea came to their mind. Once participants replied to the Eureka question, the riddle was displayed again, and the timer restarted. Every two minutes, we probed participants’ attentional focus by asking them what they were thinking about. Participants answered the question by choosing between four options (« Focused on the riddle », « Distracted by the environment », « Thoughts unrelated to the riddle », and « No thoughts ») using the keyboard (a predetermined numerical key corresponding to each option).
The solving phase of the riddle in the transfer condition followed the same experimental procedure. Participants were not informed of the relationship between the two analogous problems.
For each riddle, participants were assigned to either the solver or non-solver group, depending on their success in solving the corresponding riddle. We computed the solving rate for the naive condition (i.e., first presented riddle), and the transfer condition (i.e., second riddle presented). The solving rate corresponded to the percentage of participants who gave the correct solution anytime during the time allowed (i.e., the number of solvers divided by the number of participants who worked on this riddle), excluding participants who knew the riddle beforehand. Of note, responses of 12 participants who were already familiar with a riddle were excluded (Bar: n = 5 in naive condition and n = 5 in transfer condition; Car: n = 1 in naive condition and n = 1 in transfer condition).
Relatedness judgments task – RJT
Participants’ SemNets estimation was achieved via a computational method based on the RJT. In this task, participants rated the relatedness of all possible pairs of words. The RJT is based on previous research that showed how semantic distance in a semantic memory network corresponds to subjective relatedness ratings64,65. This method estimates an individual’s SemNet structure based on relatedness judgments to all possible pairs of a set of cue words48, and has been applied across different languages and cultures48,52,59. The RJT serves as a proxy of the organization of these words in an individual’s SemNet. An n × n matrix is constructed, in which n represents the number of words used in the RJT, and each cell represents the relatedness rating given by the participant for these two words. This matrix represents a participant’s individual SemNet.
We built verbal material for the RJT that was specific to each riddle and consisted of a list of 20 different words (four different lists for Zoe, Daniel, Car, and Bar riddles; see Table S3). The same list was used in the RJT performed before (pre-RJT) and after (post-RJT) working on a given riddle. To create those lists, we used a two-step procedure. First, three of the co-authors, experts in creativity research (TB, DO, EV), independently proposed up to 30 words for each riddle (blind procedure). Each of them adopted the approach used by Durso et al. 12, consisting of selecting words that were explicitly stated in the problem (e.g., bar and shotgun in the Bar riddle), related to the solution (e.g., remedy and relieve in the Bar riddle), or usually associated with the problem but not with the solution (e.g., drunk and loaded in the Bar riddle). Words could be verbs, nouns, or adjectives. To ensure that selected words could be easily accessible in an individual’s SemNet, we made sure that only frequent words were listed, with a lexical frequency higher than one million occurrences in the lexicon database66 (http://www.lexique.org/). Second, the three experts shared their respective lists and reached a consensus for 20 words per riddle (including, on average, 4 ± 0.8 words explicitly related to the problem, 6 ± 1 words related to the solution, and 10 ± 1 words loosely associated with the problem but unrelated to the solution). During this selection process, we were careful to avoid words that were too closely related to the solution (e.g., game in the Zoe riddle), too strongly associated with other ones (e.g., bar and barman in the Bar riddle), or too distant from all of the other words within the same list. We retained 20 words (rather than 14 in the Durso et al. study12) to obtain a larger SemNet (larger graphs are ideal for finding subtle differences in global metrics). As a side note, for the Bar riddle, we used 10 out of the 14 words used in the Durso et al. study12 along with ten novel words. We discarded four words (paper bag, pretzel, man, and barman) from Durso’s original list based on pilot experiments, which showed that they were not related to the problem (paper bag) for French people or were isolated from the other words (pretzel), or were too strongly related to bar (man and barman) thus biasing the SemNets metrics.
During the RJT, participants were presented with all possible combinations of 20 word pairs (n = 190) based on a riddle-specific 20-word list. On each trial, a different word pair was displayed on the screen, and participants were asked to rate the strength of semantic association or relatedness between the two words on a visual scale from 0 (“unrelated”) to 100 (“strongly related”), using a slider (Fig. 1B). The visual scale was displayed below the word pair on each trial and stayed on the screen until the participant responded. Participants had up to 4.5 s to respond using the computer mouse and validate their rating with a left click. The order of trials was initially pseudo-randomized and then fixed across subjects. We used the Mix software67 to generate a pseudo-random order where each word appeared equally on the right and left sides of the screen and did not repeat in two consecutive trials. Before starting the task, participants were instructed to answer as quickly and spontaneously as possible and completed 25 practice trials. Before each first riddle-specific RJT, all the words that composed the pairs were successively displayed on the screen.
Impact rating and semantic distance variables
To examine whether changes occurred in a specific part of participants’ SemNets, we created two variables: the impact rating and the semantic distance.
The impact rating variable represented how much each edge and node were relevant in solving a riddle. We asked nine independent and external judges to rate how helpful or misleading the link between the words of each of the 190 pairs was in solving a given riddle. The judges scored each riddle separately. They first read the riddle and were given the solution. Then, they rated the importance of each word pair to solve the riddle using a visual scale ranging from −50 (“misleading”) to 50 (“helpful”), centered on 0 (“neutral”). Each word pair was successively displayed on the screen above the visual scale in the same way as during the RJT procedure described above. There was no time limit to respond. By averaging the ratings across the judges and then z-scoring across the 190 word pairs, we obtained the impact rating, which quantifies the relevance of each word pair (n = 190) for solving the riddle. We also computed an indirect impact score determining the importance of each word to solve the riddle. This indirect score was calculated by averaging the impact rating of the pairs involving this word (n = 19 pairs per word) for each word. Then, we z-scored the obtained values across the 20 riddle-specific words. This procedure was repeated for each riddle-specific word list. These impact ratings allowed us to weigh word pairs (edges) and words (nodes) according to their relevance for solving the problem: the higher the score, the more we considered the pair or the word helpful. The impact rating allowed us to explore a solution-based restructuring corresponding to SemNets changes toward an optimal representation that integrated the problem and its solution.
Intraclass coefficient (ICC) was higher than 0.80 for all riddles (Zoe: ICC = 0.93; Car: ICC = 0.84; Bar: ICC = 0.90; and Daniel: ICC = 0.94), suggesting good inter-judge reliability. Distributions of impact rating show that our riddle-specific RJT material captures word associations of varying degrees of relevance for solving the riddle (Figs. S2A and S3A).
The semantic distance variable represented how much two words were semantically distant in general, independently of the problem-solving context. We used the ratings collected during the first RJT (i.e., before the problem presentation) from all participants included in the three experiments. For each riddle, we computed a riddle-specific semantic distance corresponding to the median value of the participants’ ratings for each word pair (Zoe: n = 193; Car: n = 38; Bar = 34; Daniel: n = 34 participants). We then z-scored the semantic distance across the 190 median values obtained. As we did for the impact rating, we also computed an indirect semantic score determining the semantic isolation of a word in relation to the others. This indirect score was calculated by averaging the semantic distance of the pairs involving this word (n = 19 pairs per word) for each word. Then, we z-scored the obtained values across the 20 riddle-specific words. This procedure was repeated for each riddle-specific word list. These semantic distances allowed us to weigh word pairs (edges) and words (nodes) according to the semantic remoteness: the higher the score, the more we considered a word pair semantically distant or a word semantically isolated. The semantic distance allowed us to explore a remoteness-based restructuring that corresponded to SemNets changes targeting problem-related associations that were semantically remote.
We provided the distribution of each riddle-specific semantic distance in Figs. S2A and S3A and the relationship between impact rating and semantic distance in Figs. S2B and S3B. We observed that solution-relevant edges or nodes were usually also semantically remote (and conversely), but the correlation was weak. Thus, some edges could be solution-relevant but semantically close (for instance to write – ground for the Zoe riddle, or relieved – remedy for the Bar riddle), and other edges could be solution-irrelevant but semantically distant (for instance to fly – space for the Zoe riddle, or to die – bar for the Bar riddle). This suggests that impact rating and semantic distance variables could capture different effects.
Individual-based semantic memory networks
For each participant and each riddle independently, we built two SemNets based on RJT ratings collected before the presentation of the problem (Pre-SemNet) and after attempting to solve the problem (Post-SemNet) (Fig. 1A). These networks were represented as a 20 × 20 adjacency matrix (one word per row and column) containing all values of the individual RJT ratings. Based on previous studies using this approach48,49,52,53,59,61, we applied a weighted undirected network method.
In these estimated weighted undirected networks, the relation between node a and node b is equal to the relation between node b and node a (i.e., symmetrical adjacency matrix), all edges are kept in the network, and edges are weighted based on the judgements (without any transformation) provided by each participant during the RJT48. The benefit of this methodology is that it avoids any arbitrary thresholding of edges for network filtering. This is critical for capturing the possible weaker connections of semantic relationships in lexicons52,59.
For each SemNet (pre-RJT and post-RJT), we computed SemNets metrics (adapted for weighted undirected network method) that quantify the connectivity properties of a network using the Brain Connectivity Toolbox68 (version 2019-03-03) running with Matlab R2020. We used a limited set of SemNets metrics, commonly used in cognitive research and previously linked to creative abilities as a trait41,43,44,68,69,70. We hypothesized that they could thus potentially also explain the creative process as well. These metrics all quantified a different characteristic of SemNets (edge metric, node metric, centrality metric).
We computed several metrics for each node (n = 20) and edge (n = 190) in the SemNets, including: (1) the weight, that is the brute strength of association extracted from RJT ratings (the higher the weight is, the more associated two nodes are) and is thus easily interpretable; (2) the efficiency, that is the inverse shortest path length between two nodes (the higher the efficiency is, the more efficient the connection between two nodes is) and has been shown to be a more suitable measure than path length in individual-based SemNets such as the ones we analyzed in our study59; (3) the clustering coefficient, that is the degree to which neighbor nodes are also connected to one another (the higher the clustering coefficient is, the more interconnected words are); and (4) the eigenvector centrality, that is a self-referential measure of centrality that considers the centrality of neighbor (the higher the eigenvector centrality is, the more central and influent the node is) and is the centrality measure with the highest reliability compared to other centrality measures in cognitive networks66. In previous studies, efficiency, clustering coefficient, and eigenvector centrality have all shown promising correlations with creativity measures52,53,61,71,72. For example, more creative individuals often exhibit a more connected (higher clustering coefficient) and efficient (higher efficiency) SemNet than less creative individuals48,49,51,52,60. This suggests that ideas in more creative people were more interconnected and closer, leading to more flexible and efficient spontaneous association of ideas.
Then, we compared pre- and post-SemNets local metrics to explore changes in the properties of SemNets that could be related to creative problem-solving. For this purpose, we calculated an individual difference for each metric between the SemNet built after and before a riddle (ΔMetric = MetricPost-SemNet – MetricPre-SemNet). The higher the ΔMetric, the larger the increase in the considered metric after working on the riddle.
We excluded one RJT of two participants from SemNets metrics analyses because of technical issues during this specific task (Bar: n = 1; Zoe: n = 1). In addition, we excluded the RJT in which participants did not respond or rated the word pairs as zero in more than 10% of all trials in one RJT (Zoe: n = 12; Bar: n = 10; Daniel: n = 15; Car: n = 11). We considered that these participants were not sufficiently engaged in the RJT and that missing or zero ratings would importantly bias the network with missing links. Non-responses were substituted by a zero for metrics that cannot be computed if missing values are included. The final sample included 22 solvers (Zoe: n = 10; Daniel: n = 3; Bar: n = 2; Car: n = 7) and 120 non solvers (Zoe: n = 26; Daniel: n = 31; Bar: n = 32; Car: n = 31) distributed over 80 different participants (see Tables S4 and S5 for more details).
Creativity tasks
In addition, we explored how the ability to solve the riddles related to creative abilities measured with several tasks including an adaptation of the remote associate task73,74, the short version of the Torrance test of creative thinking75, and the inventory of creative activities and achievements (ICAA)76. All the methodology and results related to these tasks are detailed in the Supplementary Note 1. The creativity tasks did not interfere with the riddle as they were semantically unrelated.
Statistical analyses
To explore the impact of analogical transfer in problem-solving, we tested whether the solving rate (all riddles confounded) differed between naive and transfer conditions using chi-square analyses (corrected with Yates method if needed). The same analyses at the riddle level were provided in the Supplementary Note 2. In addition, we compared the averaged response time of correct responses (all riddles confounded) between naive and the transfer conditions using non-parametric paired Wilcoxon tests. We ran additional chi-square tests (i) to ensure that the solving rate was not dependent of the experimental design (first or second presentation order of the pair of riddles), and (ii) to explore whether the solving rates of riddles in the transfer condition differed whether the initial riddle was correctly solved or not.
Then, we investigated the relationships between solving success and insight solving by exploring the proportion of Eureka reports in correct versus incorrect responses. To this end, we ran a chi-square test for the naive and transfer conditions separately, grouping all the riddles and all the participants together, excluding missing values.
Finally, additional analyses were conducted to explore participants’ response confidence when giving correct responses (versus incorrect responses), and their attentional level during the solving phases using the probes. The methodology and results of these analyses are detailed in Supplementary Note 3.
We used a nonlinear mixed-effects model to explore how changes in SemNets related to a problem could predict its solving. In this model, successful solving was the dependent variable (isSolved, binary variable), and the independent variables were the difference between the two SemNets of a given metric (ΔMetric, continuous variable), the impact rating (IR, continuous variable), the semantic distance (SD, continuous variable), and the interaction factor between the three (ΔMetric × IR, ΔMetric × SD, ΔMetric × IR × SD, continuous variables). ΔMetric, impact rating, and semantic distance variables were z-scored across the whole group. Participants were entered as a random-effect factor in the model on both the intercept (1|Subject) and slope (ΔMetric|Subject). By default, we considered that the two random effects were independent as we have no argument to claim that subject would differ similarly on both slope and intercept. These random effects allow us to take into account the repeated measures across subjects as a random-effect factor (Subject, maximum two riddles per subject) and inter-individual variability. The model can be formalized as follows:
$${{{{{\mathrm{isSolved}}}}}} = \,{{{{{\bf{\beta }}}}}}_0 + {{{{{\bf{\beta }}}}}}_1 \times \Delta {{{{{\mathrm{Metric}}}}}} + {{{{{\bf{\beta }}}}}}_2 \times {{{{{\mathrm{IR}}}}}} + {{{{{\bf{\beta }}}}}}_3 \times {{{{{\mathrm{SD}}}}}} + {{{{{\bf{\beta }}}}}}_4\left( {\Delta {{{{{\mathrm{Metric}}}}}} \times {{{{{\mathrm{IR}}}}}}} \right) \\ + {{{{{\bf{\beta }}}}}}_5\left( {\Delta {{{{{\mathrm{Metric}}}}}} \times {{{{{\mathrm{SD}}}}}}} \right) + {{{{{\bf{\beta }}}}}}_6\left( {{{{{{\mathrm{IR}}}}}} \times {{{{{\mathrm{SD}}}}}}} \right) + {{{{{\bf{\beta }}}}}}_7\left( {\Delta {{{{{\mathrm{Metric}}}}}} \times {{{{{\mathrm{IR}}}}}} \times {{{{{\mathrm{SD}}}}}}} \right) \\ + \left( {1|{{{{{\mathrm{Subject}}}}}}} \right) + \left( { – 1 + \Delta {{{{{\mathrm{Metric}}}}}}|{{{{{\mathrm{Subject}}}}}}} \right)$$
(1)
We designed similar nonlinear mixed-effects models to explore how changes in SemNets related to a problem could predict the solving of an analogous one. Here, analogous problem-solving was the dependent variable (isTransfer, binary variable). The independent variables were the same as in the previous model (i.e., ΔMetric impact rating, semantic distance, and all possible interactions). ΔMetric, impact rating, and semantic distance variables were z-scored. Participants were entered as a random-effect factor in the model. The models can be formalized as follows:
$${{{{{\rm{isTransfer}}}}}} \,= \,{{{{{{\bf{\beta }}}}}}}_{0}+{{{{{{\bf{\beta }}}}}}}_{1} \times \Delta {{{{{\rm{Metric}}}}}}+{{{{{{\bf{\beta }}}}}}}_{2} \times \; {{{{{{\rm{IR}}}}}}} + {{{{{{\bf{\beta }}}}}}}_{3} \times \; {{{{{\rm{SD}}}}}} +{{{{{{\bf{\beta }}}}}}}_{4}(\Delta {{{{{\rm{Metric}}}}}} \; \times \; {{{{{\rm{IR}}}}}}) \\ +{{{{{{\bf{\beta }}}}}}}_{5}(\Delta {{{{{\rm{Metric}}}}}} \; \times \; {{{{{\rm{SD}}}}}})+{{{{{{\bf{\beta }}}}}}}_{6}({{{{{\rm{IR}}}}}} \; \times \; {{{{{\rm{SD}}}}}}) +{{{{{{\bf{\beta }}}}}}}_{7}(\Delta {{{{{\rm{Metric}}}}}} \; \times \; {{{{{\rm{IR}}}}}} \; \times \; {{{{{\rm{SD}}}}}}) \\ +(1|{{{{{\rm{Subject}}}}}})+(-1+\Delta {{{{{\rm{Metric}}}}}}|{{{{{\rm{Subject}}}}}})$$
(2)
By adding both impact rating and semantic distance in statistical models, the common variance between the two variables is left out in the model residues, allowing us to distinguish changes in SemNets that are purely driven by the solution and those likely to capture more specifically the creative restructuring process (because they reflect how initially remote concepts are combined).
In all these models, we were particularly interested in the ΔMetric effect, the ΔMetric by impact rating interaction effect, and the ΔMetric by semantic distance interaction effect. A ΔMetric effect represents whether a restructuring at the global (SemNet) level (i.e., average of ΔMetric across edges/nodes at the individual level) was associated with successful problem-solving. A ΔMetric × impact rating interaction effect represents a local restructuring in parts of the SemNet that have been assessed as relevant in solving the problem (i.e., a solution-based restructuring). A ΔMetric × semantic distance interaction effect represents a local restructuring targeting the most semantically distant word pairs in the SemNet (i.e., a remoteness-based restructuring). Finally, a ΔMetric × impact rating x semantic distance interaction effect explores whether solution-based and remoteness-based restructuring have a synergistic or opposite effect.
We replicated the same model for each metric (weight, efficiency, clustering coefficient, and eigenvector centrality). Hence, we applied a correction for multiple comparisons adapted for correlated variables77. We calculated the effective number of tests (Meff) among our four correlated variables (weight, efficiency, clustering coefficient, and eigenvector centrality) with the following formula:
$${{{{{\mathrm{M}}}}}}_{{{{{{\mathrm{eff}}}}}}} = 1 + \left[ {\left( {{{{{{\mathrm{k}}}}}} – 1} \right) \times \left( {1 – {\mathop{{{{{\rm{var}}}}}}} \left( {{{{{{\mathrm{lambda}}}}}}} \right)/{{{{{\mathrm{k}}}}}}} \right)} \right]$$
(3)
In this formula, k represents the number of correlated variables (in our case, k = 4), and lambda is a vector of eigenvalues of length k for the variables of interest. To compute lambda, we built a correlation matrix of ΔMetric between the four variables using Spearman correlation (Table S6). We first averaged ΔMetric at the individual level because we did not have the same number of ΔMetric values for each variable (190 for edge metrics, and 20 for node metrics). The vector of eigenvalues was computed using eigen function in Rstudio. The resulting Meff indicated a correction for 2.67 tests, resulting in a significant p value threshold of 0.0187 (i.e., 0.05/Meff).
All nonlinear mixed models were run on Rstudio (v 1.4.1717) with glmer function. For each significant model, we calculated the balanced accuracy. It measures the probability that the model correctly classifies the variables according to the condition to be explained (i.e., solver or non-solver), considering its unbalanced distribution. Finally, to ensure that the significant relationships that we observed between SemNets changes and problem-solving were not influenced by individual creative abilities, we ran the same models with each creativity score added as a predictor. These control analyses investigated whether the results remained significant after adding creative measures to the statistical models (see Supplementary Note 1).
Replication study (Study 2)
Since our approach is novel, we ran a replication study in an independent sample to ensure the validity of our results. This second sample comprised 151 participants (mean age = 22 years, SEM = 1.80 years; 112 women and 39 men), recruited under the same inclusion criteria and ethical approval as the initial study. Participants followed the same experimental procedure (RJT before the riddle presentation and after a 10-min solving phase), except that they only had to solve one riddle, the same for everyone (we chose the Zoe riddle because it had the largest solving rate in our initial study). We arbitrarily chose to include about 150 participants to verify that the effects of the initial study were replicated. This sample size triples the number of individuals compared to the initial sample (49 individuals had to solve Zoe riddle). We used the same material (Zoe riddle and its 20 words list) and the same SemNets estimation procedure detailed above (in particular, we used the same SemNets metrics).
We excluded five participants because they already knew the riddle, and one additional participant because of a technical issue during the experiment. For the SemNets statistical analyses, 26 participants (four solvers and 22 non-solvers) were excluded following the same criteria used for SemNets cleaning as in the initial study (>10% zero ratings or missing values in the RJT). We also excluded one participant who found the solution after the post-RJT since we did not know if the solution came to his/her mind in the midst of performing the RJT (potentially influencing the rating halfway through the RJT). The final sample comprised 118 participants, including 27 solvers (23%) and 91 non-solvers (77%).
We used similar statistical analyses to explore the relationship between SemNets changes and problem-solving. Because of the new data format (i.e., one riddle per individual), we removed the participants’ random-effect factor on the intercept from the nonlinear mixed-effects models. This random effect was added in the initial models to capture the repeated measures across subjects, which is no longer relevant here. However, we kept the participants’ random-effect factor on the ΔMetric. The model used in the replication sample can be formalized as follows:
$${{{{{\mathrm{isSolved}}}}}} = \,{{{{{\bf{\beta }}}}}}_0 + {{{{{\bf{\beta }}}}}}_1 \times \Delta {{{{{\mathrm{Metric}}}}}} + {{{{{\bf{\beta }}}}}}_2 \times {{{{{\mathrm{IR}}}}}} + {{{{{\bf{\beta }}}}}}_3 \times {{{{{\mathrm{SD}}}}}} + {{{{{\bf{\beta }}}}}}_4\left( \Delta {{{{{\mathrm{Metric}}}}}} \times {{{{{\mathrm{IR}}}}}} \right) \\ + {{{{{\bf{\beta }}}}}}_5 \left( \Delta {{{{{\mathrm{Metric}}}}}} \times {{{{{\mathrm{SD}}}}}} \right) + {{{{{\bf{\beta }}}}}}_6\left( {{{{{\mathrm{IR}}}}}} \times {{{{{\mathrm{SD}}}}}} \right) + {{{{{\bf{\beta }}}}}}_7\left( {\Delta {{{{{\mathrm{Metric}}}}}} \times {{{{{\mathrm{IR}}}}}} \times {{{{{\mathrm{SD}}}}}}} \right) \\ + \left( { – 1 + \Delta {{{{{\mathrm{Metric}}}}}}|{{{{{\mathrm{Subject}}}}}}} \right)$$
(4)
Finally, we explored if SemNets changes were different whether participants solved the problem with a Eureka (i.e., insight problem-solving) or not. This analysis could not be done in Study 1 alone because of the low solving rate of the riddles. Hence, we combined the solvers of Zoe riddle from Studies 1 (n = 10, including 9 with Eureka) and 2 (n = 26, including 20 with Eureka). Note that one participant was removed from Study 2 because of missing data concerning the Eureka report. We used similar statistical analyses to explore the relationship between SemNets changes and insight problem-solving (isInsight, binary variable) as above. The model can be formalized as follows:
$${{{{{\mathrm{isInsight}}}}}} = \,{{{{{\bf{\beta }}}}}}_0 + {{{{{\bf{\beta }}}}}}_1 \times \Delta {{{{{\mathrm{Metric}}}}}} + {{{{{\bf{\beta }}}}}}_2 \times {{{{{\mathrm{IR}}}}}} + {{{{{\bf{\beta }}}}}}_3 \times {{{{{\mathrm{SD}}}}}} + {{{{{\bf{\beta }}}}}}_4\left( {\Delta {{{{{\mathrm{Metric}}}}}} \times {{{{{\mathrm{IR}}}}}}} \right) \\ + {{{{{\bf{\beta }}}}}}_5 \left( {\Delta {{{{{\mathrm{Metric}}}}}} \times {{{{{\mathrm{SD}}}}}}} \right) + {{{{{\bf{\beta }}}}}}_6\left( {{{{{{\mathrm{IR}}}}}} \times {{{{{\mathrm{SD}}}}}}} \right) + {{{{{\bf{\beta }}}}}}_7\left( {\Delta {{{{{\mathrm{Metric}}}}}} \times {{{{{\mathrm{IR}}}}}} \times {{{{{\mathrm{SD}}}}}}} \right) \\ + \left( { – 1 + \Delta {{{{{\mathrm{Metric}}}}}}|{{{{{\mathrm{Subject}}}}}}} \right)$$
(5)
The statistical results were not corrected for multiple comparisons in the analyses of Study 2 because our choice of SemNets metrics was hypotheses-driven, following the results of Study 1.
Control study (Study 3)
We ran an additional study to better understand how restructuring (measured by changes in SemNets organization) promoted problem-solving. Specifically, Study 3 explored whether changes in SemNets organization differed between participants who found the solution by themselves (solver group) from those to whom the solution was given (solution group).
This third sample comprised 47 new participants (mean age = 26 years, SEM = 0.73 years; 27 women and 20 men), recruited under the same inclusion criteria and ethical approval as the previous studies. Participants followed the same experimental procedure as in Study 2 (RJT before the riddle presentation and after a 10-min solving phase, only Zoe riddle, no riddle in transfer condition). We used the same material (Zoe riddle and its 20 RJT words list) and the same SemNets estimation procedure detailed above (in particular, we used the same SemNets metrics). The only difference concerned the non-solvers: at the end of the 10-min allotted time to solve the riddle, the solution was given to participants who failed in solving the riddle before completing the second RJT.
For the SemNets analyses, nine participants (two solvers and seven non-solvers) were excluded following the same exclusion criteria based on the SemNets cleaning as in the initial study (>10% zero ratings or missing values in the RJT). Three additional solvers were excluded because the experimenter accidentally gave them the solution before completing the second RJT. The final sample included 35 participants, with ten in the solver group (29%) and 25 in the solution group (71%). To increase our statistical power, we combined the ten solvers of Study 3 with all the solvers of Zoe riddle from Studies 1 and 2. Thus, in total, the solver group was composed of 47 participants (Study 1: n = 10; Study 2: n = 27; Study 3: n = 10).
We used the same statistical models as before to explore whether SemNets changes were different whether participants found the solution themselves or not. In the model, the dependent variable (isSolved) was a binary variable representing whether the participant solved the problem alone. It can be formalized as follows:
$${{{{{\mathrm{isSolved}}}}}} = \, {{{{{\bf{\beta }}}}}}_0 + {{{{{\bf{\beta }}}}}}_1 \times \Delta {{{{{\mathrm{Metric}}}}}} + {{{{{\bf{\beta }}}}}}_2 \times {{{{{\mathrm{IR}}}}}} + {{{{{\bf{\beta }}}}}}_3 \times {{{{{\mathrm{SD}}}}}} + {{{{{\bf{\beta }}}}}}_4\left( {\Delta {{{{{\mathrm{Metric}}}}}} \times {{{{{\mathrm{IR}}}}}}} \right) \\ + {{{{{\bf{\beta }}}}}}_5 \left( {\Delta {{{{{\mathrm{Metric}}}}}} \times {{{{{\mathrm{SD}}}}}}} \right) + {{{{{\bf{\beta }}}}}}_6\left( {{{{{{\mathrm{IR}}}}}} \times {{{{{\mathrm{SD}}}}}}} \right) + {{{{{\bf{\beta }}}}}}_7\left( {\Delta {{{{{\mathrm{Metric}}}}}} \times {{{{{\mathrm{IR}}}}}} \times {{{{{\mathrm{SD}}}}}}} \right) \\ + \left( { – 1 + \Delta {{{{{\mathrm{Metric}}}}}}|{{{{{\mathrm{Subject}}}}}}} \right)$$
(6)
The statistical results were not corrected for multiple comparisons as our analyses and SemNets metrics were predetermined by Study 1.